Download
1 / 54
540 likes | 663 Views
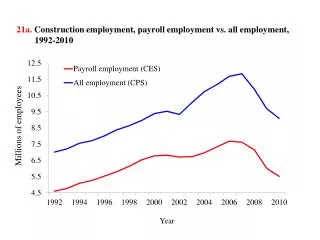
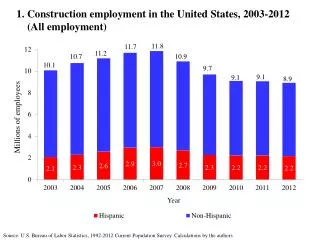
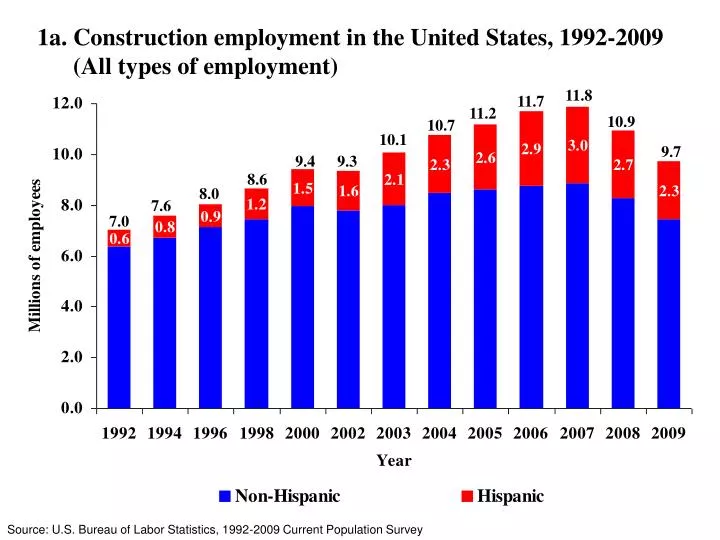
1a. Construction employment in the United States, 1992-2009 (All types of employment). 11.8. 11.7. 11.2. 10.9. 10.7. 10.1. 9.7. 9.4. 9.3. 8.6. 8.0. 7.6. 7.0. Source: U.S. Bureau of Labor Statistics, 1992-2009 Current Population Survey.

E N D
1a. Construction employment in the United States, 1992-2009 (All types of employment) 11.8 11.7 11.2 10.9 10.7 10.1 9.7 9.4 9.3 8.6 8.0 7.6 7.0 Source: U.S. Bureau of Labor Statistics, 1992-2009 Current Population Survey
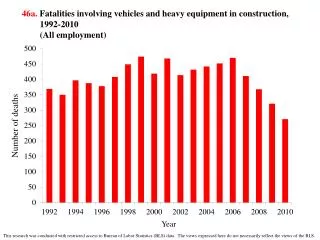
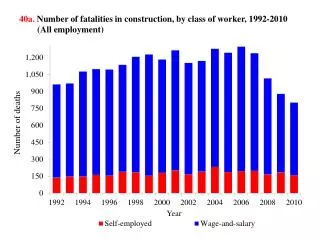
1b. Number of deaths from injuries in construction, 1992-2008 (Private and public sectors) 1,278 1,297 1,243 1,239 1,207 1,183 1,171 1,153 1,095 1,077 1,016 963 Source: U.S. Bureau of Labor Statistics, 1992-2008 Census of Fatal Occupational Injuries
2a. Rate of work-related deaths from injuries, selected industries, 1992-2008 FTE = Full-time equivalent, defined as 2,000 hours worked per year Source: U.S. Bureau of Labor Statistics, 1992-2008 Census of Fatal Occupational Injuries and Current Population Survey
2b. Rate of nonfatal injuries and illnesses with days away from work, selected industries, 1992-2008 FTE = Full-time equivalent, defined as 2,000 hours worked per year Note: Data cover the private sector only and excludes self-employed workers Source: U.S. Bureau of Labor Statistics, 1992-2008 Survey of Occupational Injuries and Illnesses
3. Rates of fatal and nonfatal injuries and illnesses in construction, 1992-2008 FTE = Full-time equivalent, defined as 2,000 hours worked per year Note: Nonfatal data covers cases with days away from work and the private sector only; self-employed workers were excluded Source: U.S. Bureau of Labor Statistics, 1992-2008 Census of Fatal Occupational Injuries, Survey of Occupational Injuries and Illnesses, and Current Population Survey
4. Average age of workers, construction versus all industries, 1992-2009 (All types of employment) 2009 Source: U.S. Bureau of Labor Statistics, 1992-2009 Current Population Survey
5a. Distribution of work-related deaths from injuries in construction, by age group, selected years Source: U.S. Bureau of Labor Statistics, Census of Fatal Occupational Injuries
5b. Distribution of nonfatal injuries and illnesses resulting in days away from work in construction, by age group, selected years Note: Data cover the private sector only and excludes self-employed workers Source: U.S. Bureau of Labor Statistics, Survey of Occupational Injuries and Illnesses
6a. Rate of work-related deaths from injuries in construction, by age group, selected years FTE = Full-time equivalent, defined as 2,000 hours worked per year Source: U.S. Bureau of Labor Statistics, Census of Fatal Occupational Injuries and Current Population Survey
6b. Rate of nonfatal injuries and illnesses resulting in days away from work in construction, by age group, selected years FTE = Full-time equivalent, defined as 2,000 hours worked per year Note: Data cover the private sector only and excludes self-employed workers Source: U.S. Bureau of Labor Statistics, Survey of Occupational Injuries and Illnesses and Current Population Survey
7a. Distribution of construction employment and work-related deaths from injuries, by establishment size, 2003-2008 average Note: Data excludes self-employed workers and cases without establishment size information. Sources: U.S. Census Bureau, 2003-2008 County Business Patterns; U.S. Bureau of Labor Statistics, 2003-2008 Census of Fatal Occupational Injuries.
7b. Rate of nonfatal occupational injuries and illnesses in construction resulting in days away from work, by establishment size, 1994-2008 FTE = Full-time equivalent, defined as 2,000 hours worked per year * Data not available for 1,000+ establishment size in 2003 Note: Establishment size data are not available prior to 1994; data cover the private sector only and excludes self-employed workers Source: U.S. Bureau of Labor Statistics, 1994-2008 Survey of Occupational Injuries and Illnesses
8a. Distribution of leading causes of work-related deaths from injuries, construction, 1992-2008 Source: U.S Bureau of Labor Statistics, 1992-2008 Census of Fatal Occupational Injuries
8b. Distribution of leading causes of nonfatal cases with days away from work, construction, 2008 Note: Data cover the private sector only and excludes self-employed workers Source: U.S. Bureau of Labor Statistics, 2008 Survey of Occupational Injuries and Illnesses
9a. The four events with the most frequent work-related deaths, construction, 1992-2008 Source: U.S. Bureau of Labor Statistics, 1992-2008 Census of Fatal Occupational Injuries
9b. Rate of leading causes of nonfatal injuries and illnesses resulting in days away from work, construction, 1992-2008 FTE = Full-time equivalent, defined as 2,000 hours worked per year Note: Data cover the private sector only and excludes self-employed workers Source: U.S. Bureau of Labor Statistics, 1992-2008 Survey of Occupational Injuries and Illnesses
10a. Number of fatal falls from work-related injuries in construction, 1992-2008 Source: U.S. Bureau of Labor Statistics, 1992-2008 Census of Fatal Occupational Injuries
10b. Changes in fatality rates in construction, fatal falls vs. all fatalities, 1992-2008 Source: U.S. Bureau of Labor Statistics, 1992-2008 Census of Fatal Occupational Injuries and Current Population Survey
11a. Type of fatal falls in construction, 2003-2008 n.e.c. = not elsewhere classified Source: U.S. Bureau of Labor Statistics, 2003-2008 Census of Fatal Occupational Injuries
11b. Type of nonfatal falls in construction, 2003-2008 n.e.c. = not elsewhere classified Source: U.S. Bureau of Labor Statistics, 2003-2008 Survey of Occupational Injuries and Illnesses
12a. Rate of fatal falls by occupation in construction, 2006-2008 FTE = Full-time equivalent, defined as 2,000 hours worked per year Source: U.S. Bureau of Labor Statistics, 2006-2008 Census of Fatal Occupational Injuries and Current Population Survey
12b. Fatal falls by age group in construction, 2003-2008 average FTE = Full-time equivalent, defined as 2,000 hours worked per year Source: U.S. Bureau of Labor Statistics, 2003-2008 Census of Fatal Occupational Injuries and Current Population Survey
13a. Percentage of work-related deaths from injuries for all construction, by hour, 1992-2008 average Note: Total of 19,619 deaths. Cases without information on time of day when injury occurred (< 13%) were excluded Source: U.S. Bureau of Labor Statistics, 1992-2008 Census of Fatal Occupational Injuries
13b. Nonfatal injuries in construction by time of day event occurred, 2008 Note: Total of 120,240 DAFW cases. Cases without information on time of day when injury occurred (< 24%) were excluded Source: U.S. Bureau of Labor Statistics, 2008 Survey of Occupational Injuries and Illnesses
14a. Number of work-related deaths from injuries, selected construction occupations, 2003-2008 Source: U.S. Bureau of Labor Statistics, 2003-2008 Census of Fatal Occupational Injuries
14b. Rate of work-related deaths from injuries, selected construction occupations, 2003-2008 average FTE = Full-time equivalent, defined as 2,000 hours worked per year Source: U.S. Bureau of Labor Statistics, 2003-2008 Census of Fatal Occupational Injuries and Current Population Survey
15a. Number of nonfatal injuries and illnesses involving days away from work, selected construction occupations, 2008 FTE = Full-time equivalent, defined as 2,000 hours worked per year Note: Total of 120,240 cases. Data cover the private sector only and excludes self-employed workers Source: U.S. Bureau of Labor Statistics, 2008 Survey of Occupational Injuries and illnesses
15b. Rate of nonfatal injuries and illnesses involving days away from work, selected construction occupations, 2008 FTE = Full-time equivalent, defined as 2,000 hours worked per year Note: Rate of 174.3 per 10,000 FTEs. Data cover the private sector only and excludes self-employed workers Source: U.S. Bureau of Labor Statistics, 2008 Survey of Occupational Injuries and illnesses and Current Population Survey
16a. Rate of work-related deaths from injuries, bricklayers vs. all construction, 1992-2008 FTE = Full-time equivalent, defined as 2,000 hours worked per year Note: Bricklayer data based on a total of 276 deaths Source: U.S. Bureau of Labor Statistics, 1992-2008 Census of Fatal Occupational Injuries and Current Population Survey
16b. Rate of nonfatal injuries and illnesses resulting in days away from work, bricklayers vs. all construction, 1992-2008 FTE = Full-time equivalent, defined as 2,000 hours worked per year Note: Data cover the private sector only and excludes self-employed workers Source: U.S. Bureau of Labor Statistics, 1992-2008 Survey of Occupational Injuries and Illnesses and Current Population Survey
17a. Rate of work-related deaths from injuries, carpenters vs. all construction, 1992-2008 FTE = Full-time equivalent, defined as 2,000 hours worked per year Note: Carpenter data based on a total of 1,546 deaths Source: U.S. Bureau of Labor Statistics, 1992-2008 Census of Fatal Occupational Injuries and Current Population Survey
17b. Rate of nonfatal injuries and illnesses resulting in days away from work, carpenters vs. all construction, 1992-2008 FTE = Full-time equivalent, defined as 2,000 hours worked per year Note: Data cover the private sector only and excludes self-employed workers Source: U.S. Bureau of Labor Statistics, 1992-2008 Survey of Occupational Injuries and Illnesses and Current Population Survey
18a. Rate of work-related deaths from injuries, construction laborers vs. all construction, 1992-2008 FTE = Full-time equivalent, defined as 2,000 hours worked per year Note: Construction laborer data based on a total of 4,928 deaths Source: U.S. Bureau of Labor Statistics, 1992-2008 Census of Fatal Occupational Injuries and Current Population Survey
18b. Rate of nonfatal injuries and illnesses resulting in days away from work, construction laborers vs. all construction, 1992-2008 FTE = Full-time equivalent, defined as 2,000 hours worked per year Note: Data cover the private sector only and excludes self-employed workers Source: U.S. Bureau of Labor Statistics, 1992-2008 Survey of Occupational Injuries and Illnesses and Current Population Survey
19a. Rate of work-related deaths from injuries, electrical power installers vs. all construction, 1992-2008 FTE = Full-time equivalent, defined as 2,000 hours worked per year Note: Electrical power installer data based on a total of 260 deaths Source: U.S. Bureau of Labor Statistics, 1992-2008 Census of Fatal Occupational Injuries and Current Population Survey
19b. Rate of nonfatal injuries and illnesses resulting in days away from work, electrical power installers vs. all construction, 1992-2008 FTE = Full-time equivalent, defined as 2,000 hours worked per year Note: Data cover the private sector only and excludes self-employed workers Source: U.S. Bureau of Labor Statistics, 1992-2008 Survey of Occupational Injuries and Illnesses and Current Population Survey
20a. Rate of work-related deaths from injuries, electricians vs. all construction, 1992-2008 FTE = Full-time equivalent, defined as 2,000 hours worked per year Note: Electrician data based on a total of 1,145 deaths Source: U.S. Bureau of Labor Statistics, 1992-2008 Census of Fatal Occupational Injuries and Current Population Survey
20b. Rate of nonfatal injuries and illnesses resulting in days away from work, electriciansvs. all construction, 1992-2008 FTE = Full-time equivalent, defined as 2,000 hours worked per year Note: Data cover the private sector only and excludes self-employed workers Source: U.S. Bureau of Labor Statistics, 1992-2008 Survey of Occupational Injuries and Illnesses and Current Population Survey
21a. Rate of work-related deaths from injuries, excavating/ loading machine operators vs. all construction, 1992-2008 FTE = Full-time equivalent, defined as 2,000 hours worked per year Note: Excavating/loading machine operator data based on a total of 204 deaths Source: U.S. Bureau of Labor Statistics, 1992-2008 Census of Fatal Occupational Injuries and Current Population Survey
21b. Rate of nonfatal injuries and illnesses resulting in days away from work, excavating/loading machine operatorsvs. all construction, 1992-2008 FTE = Full-time equivalent, defined as 2,000 hours worked per year Note: Data cover the private sector only and excludes self-employed workers Source: U.S. Bureau of Labor Statistics, 1992-2008 Survey of Occupational Injuries and Illnesses and Current Population Survey
22a. Rate of work-related deaths from injuries, ironworkers vs. all construction, 1992-2008 FTE = Full-time equivalent, defined as 2,000 hours worked per year Note: Ironworker data based on a total of 666 deaths Source: U.S. Bureau of Labor Statistics, 1992-2008 Census of Fatal Occupational Injuries and Current Population Survey
22b. Rate of nonfatal injuries and illnesses resulting in days away from work, ironworkersvs. all construction, 1992-2008 FTE = Full-time equivalent, defined as 2,000 hours worked per year Note: Data cover the private sector only and excludes self-employed workers Source: U.S. Bureau of Labor Statistics, 1992-2008 Survey of Occupational Injuries and Illnesses and Current Population Survey
23a. Rate of work-related deaths from injuries, operating engineers vs. all construction, 1992-2008 FTE = Full-time equivalent, defined as 2,000 hours worked per year Note: Operating engineer data based on a total of 684 deaths Source: U.S. Bureau of Labor Statistics, 1992-2008 Census of Fatal Occupational Injuries and Current Population Survey
23b. Rate of nonfatal injuries and illnesses resulting in days away from work, operating engineersvs. all construction, 1992-2008 FTE = Full-time equivalent, defined as 2,000 hours worked per year Note: Data cover the private sector only and excludes self-employed workers Source: U.S. Bureau of Labor Statistics, 1992-2008 Survey of Occupational Injuries and Illnesses and Current Population Survey
24a. Rate of work-related deaths from injuries, painters vs. all construction, 1992-2008 FTE = Full-time equivalent, defined as 2,000 hours worked per year Note: Painter data based on a total of 703 deaths Source: U.S. Bureau of Labor Statistics, 1992-2008 Census of Fatal Occupational Injuries and Current Population Survey
24b. Rate of nonfatal injuries and illnesses resulting in days away from work, paintersvs. all construction, 1992-2008 FTE = Full-time equivalent, defined as 2,000 hours worked per year Note: Data cover the private sector only and excludes self-employed workers Source: U.S. Bureau of Labor Statistics, 1992-2008 Survey of Occupational Injuries and Illnesses and Current Population Survey
25a. Rate of work-related deaths from injuries, plumbers vs. all construction, 1992-2008 FTE = Full-time equivalent, defined as 2,000 hours worked per year Note: Plumber data based on a total of 520 deaths Source: U.S. Bureau of Labor Statistics, 1992-2008 Census of Fatal Occupational Injuries and Current Population Survey
25b. Rate of nonfatal injuries and illnesses resulting in days away from work, plumbersvs. all construction, 1992-2008 FTE = Full-time equivalent, defined as 2,000 hours worked per year Note: Data cover the private sector only and excludes self-employed workers Source: U.S. Bureau of Labor Statistics, 1992-2008 Survey of Occupational Injuries and Illnesses and Current Population Survey
26a. Rate of work-related deaths from injuries, roofers vs. all construction, 1992-2008 FTE = Full-time equivalent, defined as 2,000 hours worked per year Note: Roofer data based on a total of 1,075 deaths Source: U.S. Bureau of Labor Statistics, 1992-2008 Census of Fatal Occupational Injuries and Current Population Survey
26b. Rate of nonfatal injuries and illnesses resulting in days away from work, roofersvs. all construction, 1992-2008 FTE = Full-time equivalent, defined as 2,000 hours worked per year Note: Data cover the private sector only and excludes self-employed workers Source: U.S. Bureau of Labor Statistics, 1992-2008 Survey of Occupational Injuries and Illnesses and Current Population Survey