Download
1 / 49
490 likes | 713 Views
Treatment Outcomes among Patients with Hepatitis C in Hawaii. Nuntra Suwantarat, MD. Thana Khawcharoenporn, MD. Teera Chentanez, MD. Alan D. Tice, M.D, FACP. Department of Medicine, John A. Burns School of Medicine, University of Hawaii ACP Chapter Meeting, Hawaii, January 12, 2008.

E N D
Treatment Outcomes among Patients with Hepatitis C in Hawaii Nuntra Suwantarat, MD. Thana Khawcharoenporn, MD. Teera Chentanez, MD. Alan D. Tice, M.D, FACP. Department of Medicine, John A. Burns School of Medicine, University of Hawaii ACP Chapter Meeting, Hawaii, January 12, 2008
Hawaii Highest rate of liver cancer in the US HCV prevalence More than 20,000 people in Hawaii have Hepatitis C virus infection Few data exists about demographics and treatment outcomes of the patients with HCV infection. By www.idlinks.com and Ken Akinaka , Hepatitis Support Network of Hawaii
Treatment of Chronic Hepatitis C Over the last 10 years 1991 SVR 6 % 16 % Ribavirin * PEG-interferon; Pegylated/long-acting PEG-interferon* SVR(Sustained Virologic Response); absence of HCV RNA in serum at least 6 months after discontinuation of therapy
HCV Treatment Outcomes with PEG-Interferon with Ribavirin • Prior studies showed that the response rates were higher among patients with genotype 2 or 3. (Treatment duration; 24 weeks) • In addition, the response rates were higher in Whites (52%) compared with Blacks (28%) among patients with genotype 1. • Other factors associated with the lower response rate include higher initial levels of HCV RNA (>600,000IU/ml), male gender, high body weight, and advanced liver fibrosis.
Objectives & Methods • To determine the characteristics, assess risk factors of treatment failure and evaluate the efficacy of the current HCV infection therapyin the Hawaii population. • Study Populations; A retrospective chart review of 50 patients (Age >18) treated with pegylated interferon and ribavirin at ambulatory clinic (from 1/04 to 12/07) was conducted.
Patient demographics • Total of 50 patients • Age, mean +SD (range) ; 49.1 + 5.6 (31-61) Gender
Discussion; Results • US prevalence; HCV is common in adults age 30-49. • More common in minority population • 3.2% in African American • 2.1% in Hispanics • 1.5% in Caucasians. • In 2005, major population is Hawaii is Asians (41.5%), followed by Caucasians (26.8%), pacific islanders (9.0%) and two or more than two races (20.1%). • In our study, Caucasians were the major racial group. The incidence of HCV patient with genotype 1 (71%) is high compatible with general incidence in US (approximately 75%).
Liver biopsy: Knodell score Mean ± SD (n=36) (range); 8.0 ± 3.4 (1-16) Knodell score > 9, n (%); 15 of 36 (41.7) (n=22)
Enrollment (50 patients) Failure of treatment (n=14) -Death (2) -Loss follow up (9) -Complication (3) Completedtreatment* (n=36) End of Treatment Viral Clearance (ETVC) (n=25) Sustained Virorogical Response (SVR) (n=21) Non -SVR (n=11)
Enrollment (50 patients) PEG interferon (weekly) Ribavirin (Weight bases, bid) Genotype 1/6; 48 weeks Genotype 2/3; 24 weeks Completedtreatment* (n=36) End of Treatment Viral Clearance (ETVC) (n=25) Sustained Virorogical Response (SVR) (n=21) Non -SVR (n=11)
Enrollment (50 patients) Completedtreatment* (n=36) ETVC; absence of HCV RNA in serum at the end of the therapy End of Treatment Viral Clearance (ETVC) (n=25) Sustained Virorogical Response (SVR) (n=21) Non -SVR (n=11)
Enrollment (50 patients) Completedtreatment* (n=36) SVR; absence of HCV RNA in serum at least 6 months after discontinuation of therapy End of Treatment Viral Clearance (n=25) Sustained Virorogical Response (SVR) (n=21) Non -SVR (n=11)
Enrollment (50 patients) Failure of treatment (n=14) -Death (2) -Loss follow up (9) -Complication (3) Completedtreatment* (n=36) End of Treatment Viral Clearance (n=25) Sustained Virorogical Response (SVR) (n=21) Non -SVR (n=11)
Treatment Outcomes P=0.034 P=0.004 P=0.011 P<0.001 P=0.002 P=0.039
Discussion; Outcomes • Outcomes of Hepatitis C treatment in Hawaii are comparable to the rested US. • The total SVR was 66% (compared to 54-56% in other studies) • for genotype 1 was 48% (compared to 52% ) • for genotypes 2/3/6 was 92% (compared to 81-84%)
Discussion; Outcomes (2) • Weight loss; Controversy • Body Weight is also the independence risk factors. • However, some studies showed that there was not significant of body weight or weight loss effect to treatment outcomes. • In our study, the patient in SVR group trend to loss weight more than in non SVR group. (P value 0.06)
Discussion; Outcomes (3) • Common side effects of treatment are thrombocytopenia or neutropenia. • In our study, platelets and WBC level significant low in SVR which reflex that susceptibility for response to treatment well. • Response to interferon is not clear and need further studies to confirm; biological clearance, susceptibility, genetic or HLA typing.
Side effects of Treatment • The medical side effects of treatment varied from influenza like symptoms, rash, nausea and vomiting, anemia, leucopenia, thrombocytopenia, fatty liver to cellulitis. • There were 11 patients who had neuropsychiatric conditions which included depression (6), anxiety (1), akathesia (1), insomnia (1), and confusion (2).
Conclusion: HCV treatment outcome in Hawaii • The failure to complete treatment was relatively high in this population but viral outcome was comparable to the mainland response and significantly correlated with genotype and viral load. • However, more population or specific population such as in Asian or Pacific-islander need for further data collection and analysis.
References; • Lauer GM., Walker BD., Hepatitis C Virus Infection: Medical progress. N Engl J Med 2005; 345: 41-51. • Hoofnagle JH., Seeff LB., Peginterferon and Ribavirin for Chronic Hepatitis C. N Engl J Med 2006; 355: 2444-51. • Shiffman ML., Suter F., Bacon BR., et al. Peginterferon Alfa-2a and Ribavirin for 16-24 weeks in HCV genotype 2 or 3. N Engl J Med 2007; 357: 124-34. • Zeuzem, S. Hetrogenous virologic response rates to interferon-based therapy in patients with hepatitis C: who responds less well? Ann Intern Med 2004: 140-370 • Bressler BL., Guindi M., Tomlinson G., Heathcote J., High body mass index is an independent risk factor for nonresponse to antiviral treatment in chronic hepatitis C. Hepatology 2003; 38: 639-644 • Males S., Gad RR., Esmat G., et al. Serum alpha-fetoprotein level predicts treatment outcome in chronic hepatitis C. Antivir Ther 2007; 1215: 797-803. • Yu Jw., Wang GQ., Sun Lj., et al. Predictive value of rapidvirological response and early virological response on sustained virological response in HCV patients treated with pegylated interferon alpha- 2a and ribavarin. J Gastroenterol Hepatol 2007;22(6): 832-6. • Wong LL., Lim W., Cheung A., et al. Liver transplant in Hawaii: The survival of a small center. Clinn Transplant 2006; 20(1): 55-61.
References (2) • Lasher LE.,Em JL., Hoang Q., et al. A case control investigation of Hepatitis C risk factors in Hawaii. Hawaii Med J 2005; 64(11): 296-300, 302-4. • Cashman TM., Elm JL Jr., Wu M., et al. Hepatitis C diagnosis and treatment: a survey of practicing physician in Hawaii. Hawaii Med J 2001; 60(6): 148-54. • 11. Chopra. SJ. Treatment of chronic hepatitis C virus infection: Recommendations for adults. In UpToDate online version 15.2 Available at http://www.utdol.com. Accessed September 2007. • 12. Rifai MA., Moles JK., Short DD. Hepatitis C Treatment Eligibility and Outcomes Among Patients With Psychiatric illness. Psychiatric Services 2006: 57: 570-2. • 13. Wong LL., Lim W., Tsai N., et al. Hepatitis B and alcohol affect survival of hepatocellular carcinoma patients. World J Gastroenterol 2005; 11(23): 3491-7. • 14. Sylvestre DL., Clements BJ. Adherence to hepatitis C treatment in recovering heroin users maintained on methadone. Eur J Gastroenterol Hepatol 2007; 19(9): 741-7. • 15. Krook AL., Stokka D., Hegar B., et al.Hepatitis C treatment of Opioid Dependents Receiving Maintenance Treatment: Results of Norwegian Pilot study. European Addiction Research 2007; 13: 216-21.
Limitations • A small number of population and some patients are still not complete at the end of treatment. Hence, there were not significant in some risk factors (such as age, body weight or BMI, history of cocaine use and other risk factors.) • However, this study showed data from realistic clinical practice HCV treatment outcomes.
Further Studies • Further studies need more population for data analysis • Patient groups for risk factors study in genotype 1 and 2/3 should beseparately analyzed data. • Studies in some specific group such as Asians and Pacific islanders are needed for evaluated difference risk factors and outcomes of treatment. • Prospective study.
Enrollment (50 patients) Failure of treatment (n=14) -Death (2) -Loss follow up (9) -Complication (3) Completedtreatment* (n=36) End of Treatment Viral Clearance (ETVC) (n=25) Sustained Virorogical Response (SVR) (n=21) Non -SVR (n=11)
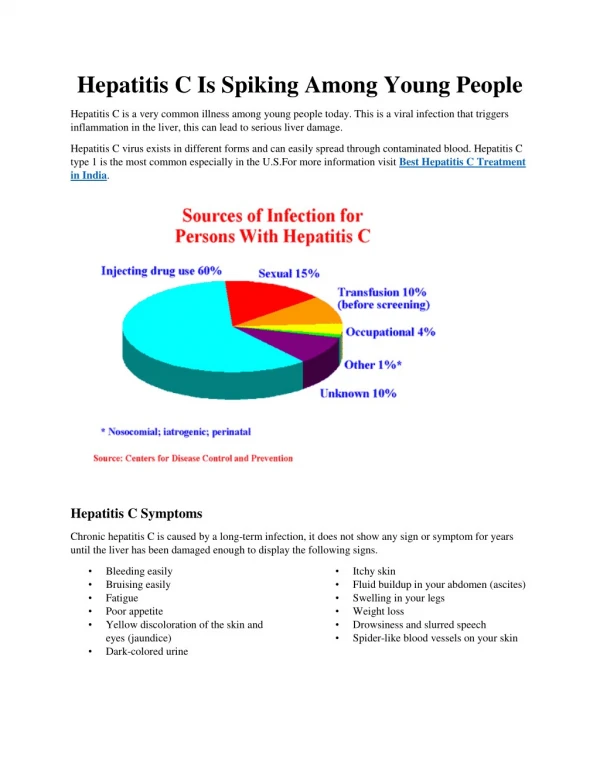
Introduction; Hepatitis C Virus • Resent study, there are 30,000 to 35,000 cases per year. Approximately 1.8 of Americans test is positive for hepatitis C and most common in adults age 30-49. It is more common in minority population, 3.2% in African American and 2.1% in Hispanics as compared to 1.5% in Caucasians. • HCV; RNA virus(6 genotypes) • The most common genotypes if HCV in the United States are genotype 1 (approximately 75% of cases), genotype 2 (approximately 15%), and genotype 3 (approximately 7%) [2]. • HCV Infection: US Prevalence • 3.2 - 4.0 million Americans • 30,000 to 35,000 cases per year. • Approx. 1.8 %of Americans test is positive for hepatitis C • Most common in adults age 30-49. • More common in minority population • 3.2% in African American • 2.1% in Hispanics • 1.5% in Caucasians.
Introduction; HCV • RNA virus: 6 genotypes • In US; • genotype 1 (75%)* • genotype 2 (15%) • genotype 3 (7%)
Outline (SKIP)/ 10 min (9) • Introduction (2min) • Objective & Methods (1min/30 sec) • Results + Discussions (2 min) • Demographics • Risk factors • Liver biopsy • Outcomes + Discussion (2min) • HI population/ compare to mainland Rx • Practical/ realistic treatment • Loss follow up; non compliance • Response of Rx Old/ New!!! Cocaine ?Weight ? Plt, WBC • Limitation/Conclusion (1 min/30 sec)
Discussion; Results (2) • In our population, the majority of patients had mild to moderate liver inflammation which determined by Knodell score as HAI. • In patients who had liver fibrosis (n =22), portal fibrosis is most common (minimal fibrosis) and only one patient had cirrhosis pattern. • Hence, there was no significant difference between SVR and non SVR could be from lack of variety of data, small population and also some missing data in ours populations. Moreover, lots of in patients with genotype 2 or 3 usually had no biopsy report.
Treatment Outcomes: • Reasons for failure to complete treatment included death (2), loss follow up (9) and medical or psychological complications (3). • Failure to complete treatment was statistically associated with high viral load (p=0.011) and high ALT (p=0.039). • The SVR was 66%; • with 47% for genotype 1 • 92% for genotypes 2/3/6. • End of treatment viral clearance and SVR groups was correlated with genotype 2/3/6 (p=0.034 and p= 0.004) and low viral load (p<0.001 and p= 0.002).
Treatment Outcomes (2) • After compare risk factors between SVR and non SVR group, there were significant in genotype of patient; genotype 1 (P 0.025) and history of tattoos (P 0.028) associated with non SVR group. • Moreover the patients in non SVR group trended to have history of cocaine use (P 0.061). • However, there were no statistical significant with other risk factors which included a history of injection drug use, blood transfusion, HIV positive, alcohol abuse, methamphetamine use, psychiatric disorder or others medical problem.
Treatment Outcomes (3) • The comparison of mean of; Age, Knodell score, weight, BMI as baseline and after complete treatment (48 weeks in genotype 1 and 6, 24 weeks in genotype 2 and 3), weight change during treatment and labs data as baseline and after complete treatment. • There was no significant of patient’s weight or BMI at the beginning and after treatment but the results showed that in SVR group had trend of more weight loss during treatment (p 0.069) compared to non SVR group. • Level of white blood cell count at the end of treatment and platelets prior to treatment and at the end of treatment were statistically significant lower in SVR group.
Enrollment (50 patients) Failure of treatment (n=14) -Death (2) -Loss follow up (9) -Complication (3) Completedtreatment* (n=36) End of Treatment Viral Clearance (ETVC) (n=25) Sustained Virorogical Response (SVR) (n=21) Non -SVR (n=11)
Statistical analysis. • Descriptive statistics was produced. • Categorical variables were compared using the Pearson’s χ2 test, Fisher’s exact. • All tests were two-tailed with P value < 0.05 considered significant. • Mean of nominal data were compared with T-test. • All statistical analyses were conducted using SPSS for Window software, version 15.0 (SPSS).
Enrollment (50 patients) • The study patients were identified from the clinic’s medical record using (ICD) code of 070.44 and 070.54. (Hepatitis C) • Information was collected using a study data collection form; • demographic characteristics • underlying/comorbid conditions • genotypes of HCV • Knodell score/ Liver biopsy • laboratory data • treatment • follow-up data