Download
1 / 16
170 likes | 342 Views
Analysis of gene expression by real-time PCR. RBCS3 and Cab-1b transcript quantitation by real time PCR. Broad and Long Term Objective.

E N D
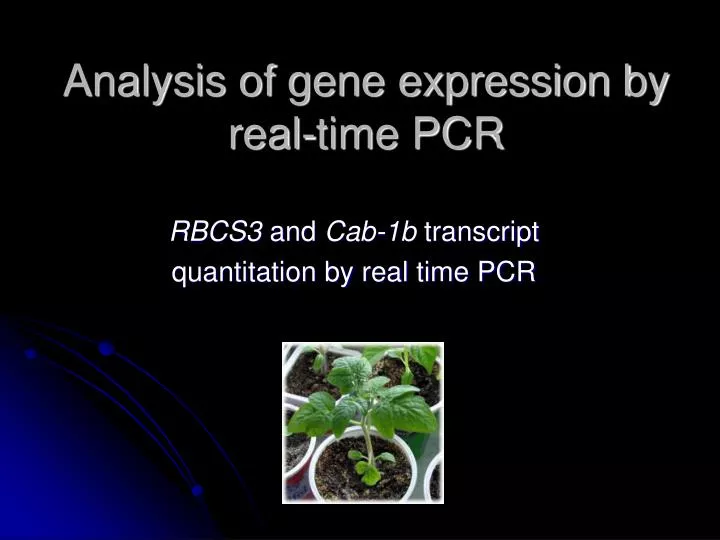
Analysis of gene expression by real-time PCR RBCS3 and Cab-1b transcript quantitation by real time PCR
Broad and Long Term Objective To characterize the expression of the genes encoding Ribulose 1-5 bisphosphate carboxylase oxygenase-3 (RBCS3) and Chlorophyll A/B binding protein-1b (Cab-1b) in the leaves of tomato plants grown under continuous light or subjected to 24 hr, 48 hr, or 72 hr in complete darkness.
Research Plan RNA Isolation from tomato leaves (continuous light or 24-72 hr darkness) RNA Electrophoresis cDNA synthesis RBCS3 and Cab-1b transcript quantitation by real time PCR Analysis of real time PCR data
Today’s Laboratory Objectives • To set up and run a series of real time PCR reactions with Cab-1b- and RBCS3-specific primers • To understand the theoretical basis of real time PCR and its quantitative applications
PCR • 10X buffer • Primers • Taq DNA • polymerase • dNTPs • template DNA After 30 thermocycles, a DNA molecule initially present in a single copy is present in > 1 billion copies
Standard PCR is non-quantitative Primers/dNTPs exhausted 100 electrophoresis DNA amount (arbitrary units) Post-PCR DNA quantitation 0 15 30 PCR cycle # Equal amounts of PCR product White tube= 1000 copies Green tube= 10 copies
Real time PCR is quantitative 100 White tube= 1000 copies Green tube= 10 copies • 10X buffer • Primers • Taq DNA • polymerase • dNTPs • template DNA • fluorescent • “marker” of • dsDNA Ct = 10.0 Fluorescence (arbitrary units) Ct = 16.6 6.6 Fluorescence threshold 0 15 30 16.6-10.0 = 6.6 cycles 26.6 = 100 White sample is 100-fold more abundant than green sample “real time” DNA quantitation
Output data from real time PCR Fluorescence (arbitrary units) PCR cycle #
Fluorescence-based chemistries for quantitation of dsDNA • SYBR green I • cyanine dye (abs. 480nm, em. 520nm) • binds almost exclusively to dsDNA • (minor groove) • fluorescence increases >1000-fold • when bound to DNA • sensitive, but nonspecific • TaqMan • 15-30 bp ssDNA probe, complementary • to template DNA sequence • 5’ fluorescent dye, 3’ fluorescence • quencher • Taq 5’ exonuclease activity cleaves • ssDNA probe, releasing free dye into • solution (fluorescence) • sensitive, sequence specific, multiplex • PCR possible
Fluorescence-based chemistries for quantitation of dsDNA • Molecular beacons • 40-50 bp ssDNA probe, the central region of • sequence is complementary to template DNA • 5’ fluorescent dye, 3’ fluorescence quencher • 5’ and 3’ end of sequence are self complementary, • form stem loop structure which promotes • fluorescence quenching • during annealing phase of PCR, the central part • of the probe hybridizes with the complementary • template DNA sequence, separating fluorescent • dye and quencher, resulting in fluorescence For all chemistries, fluorescence and dsDNA content are directly proportional (i.e. fluorescence doubles after each thermocycle). Therefore, DNA content in the PCR reaction can be quantified after each cycle by measuring fluorescence
Real time PCR hardware Optical quality PCR tubes or 96 well plate BioRad icycler excitation emission * Illumination: laser, LED, tungsten halogen bulb Detector: photomultiplier Light filter
Experimental Design Time Series • RNA Extractions Performed on tomato plants grown in the light or in darkness for 24, 48, or 72 hrs • Each sample assayed in triplicate in 96-well format Reaction Mix cDNA (diluted 1:100) 5.0 μl Sybr Green Super Mix 7.1 μl Primer RB1 or CA1 (20 μM) 0.3 μl Primer RB2 or CA2 (20 μM) 0.3 μl dH2O 12.3 μl total volume per reaction 25 μl 8 total reactions per group (e.g. 3 RB1/RB2 + light cDNA, 3 RB1/RB2 + dark cDNA, 2 RB1/RB2 + water)
Real Time RT PCR Cycling Parameters Polymerase activation 95° C 10 min 40 cycles Denaturation 95° C 10 sec Primer Annealing 60° C 30 sec Extension 72° C 30 sec Melt Curves Denaturation 95° C 1 min Renaturation 55° C 1 min Denaturation Ramp 0.5° C every 10 sec
Alternative methods for transcript quantitation RNase protection assay Northern Blot
Next Week Analysis of real time PCR data
RNA gels Class gels RNA ladder Expected result (plant RNA)