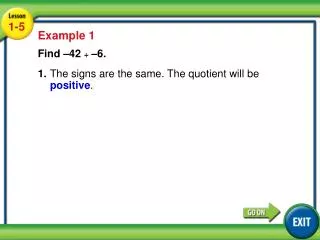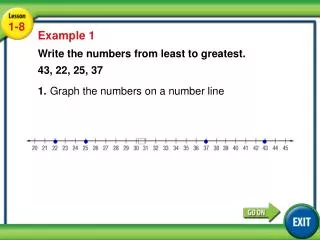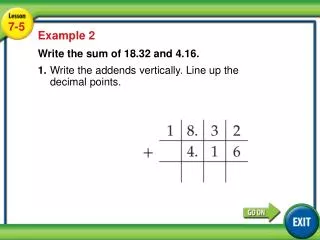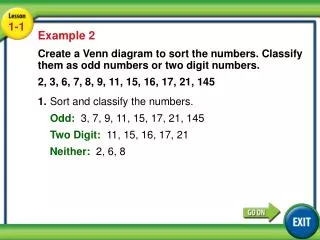
Lesson 7-5 Example 1
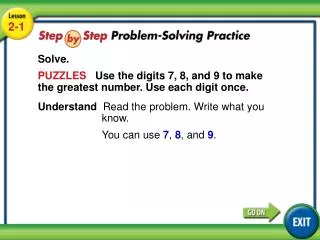
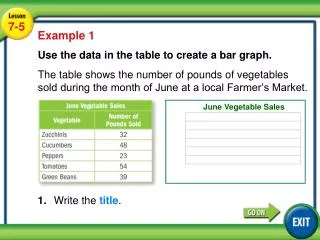
Use the data in the table to create a bar graph. The table shows the number of pounds of vegetables sold during the month of June at a local Farmer’s Market. Example 1. June Vegetable Sales. 1. Write the title. Lesson 7-5 Example 1. Example 1.

Lesson 7-5 Example 1
E N D
Presentation Transcript
Use the data in the table to create a bar graph. The table shows the number of pounds of vegetables sold during the month of June at a local Farmer’s Market. Example 1 June Vegetable Sales 1. Write the title. Lesson 7-5 Example 1
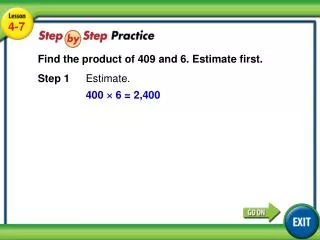
Example 1 Use the data in the table to create a bar graph. The table shows the number of pounds of vegetables sold during the month of June at a local Farmer’s Market. June Vegetable Sales Number of Pounds Sold Vegetable 2. Label the horizontal and vertical axes. Lesson 7-5 Example 1
Example 1 Use the data in the table to create a bar graph. The table shows the number of pounds of vegetables sold during the month of June at a local Farmer’s Market. June Vegetable Sales 60 50 40 30 Number of Pounds Sold 20 10 0 Zucchinis Cucumbers Peppers Tomatoes Green Beans Vegetable 3. Choose the interval and complete the scale. Lesson 7-5 Example 1
Example 1 Use the data in the table to create a bar graph. The table shows the number of pounds of vegetables sold during the month of June at a local Farmer’s Market. June Vegetable Sales 60 50 40 30 Number of Pounds Sold 20 10 0 Zucchinis Cucumbers Peppers Tomatoes Green Beans Vegetable 4. Draw the bars to represent the number of points. Lesson 7-5 Example 1