Download
1 / 11
110 likes | 223 Views
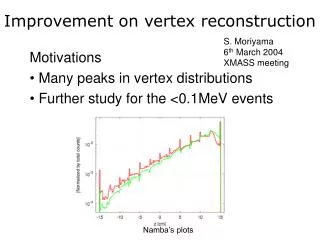
S. Moriyama 6 th March 2004 XMASS meeting. Improvement on vertex reconstruction. Motivations Many peaks in vertex distributions Further study for the <0.1MeV events. Namba’s plots. Problem in the vertex reconstruction.

E N D
S. Moriyama 6th March 2004 XMASS meeting Improvement on vertex reconstruction Motivations Many peaks in vertex distributions Further study for the <0.1MeV events Namba’s plots
Problem in the vertex reconstruction • We are using maps which have value on a 2.5cm spacing grid. F(ix,iy,iz,ith PMT) • Between grid points, F(probability to observe photoelectron by ith PMT) is obtained by a linear interpolation. F(x,y,z, ith PMT) • Namba pointed out that there must be discontinuity of dF/dx, etc, on the grid edge. When I saw likelihood distribution, there is a valley on the grid edge due to the dF/dx discontinuity.
One example: How to solve? Likelihood Zoom up Likelihood * Actual likelihood • Adopt higher order interpolation for the maps. Technically complex for me. • Slightly modify likelihood distribution near the current best fit point. looks good. Best fit here 2nd order polynomial fit Concentration to the grid is now understood. Z(cm) Z(cm)
Principle of the improvement • For the events wall>2cm, vertex improvement code is called. • In the code, likelihood along x, y, and z axis is calculated by 1mm spacing for +/- 1cm region. • For each likelihood, 2nd order ploynomial fit is performed based on the 1mm spacing data, and adopt minimum value of the 2nd order polynomial as a new fitted result. • No modification for energy information (/home/xmass/src/reconst_v6.0)
Effect on the source run analysis (Namba) MC Data Improvement succeeded. Further improvement needs maps with more fine spacing.
Performance check revisited… • Minamino?
Background data and MC • Note: There was a bug in MC treatment after applying reconst_v4.4 (improvement on <0.1MeV analysis), but there is almost no change by the bug fix. Almost no change observed
How about <0.1MeV events? • Detail check of wall distribution • Horizontal axis (15.5-wall)**3 uniform volume plots can be seen. • ~0.6kg/bin
Background distributions Data MC 0.4-0.5MeV 0.5-1MeV 0.1-0.2MeV 0-0.1MeV • Horizontal: cm3 (125cm3==10cmFV, 1000cm3==20cmFV) • Vertical: DRU 0.2-0.3MeV 0.3-0.4MeV 1-2MeV 2-3MeV
0-0.1MeV 0.1-0.2MeV 0.2-0.3MeV 0.3-0.4MeV
Summary • Improvement on the vertex reconstruction done. • Still there is small grid effect. It will be improved by making fine maps. • <0.1MeV problem and Kr like signals seems to be related. Further study is needed why event concentration at the detector center occurs.