Download
1 / 39
390 likes | 554 Views
Conducting Cost-Effectiveness Analyses of Behavioral Interventions. Todd H. Wagner, Ph.D. Mary K. Goldstein, M.D. Acknowledgements. Partial funding was through a grant from the National Cancer Institute (2PO1 CA 55112-05A1).

E N D
Conducting Cost-Effectiveness Analyses of Behavioral Interventions Todd H. Wagner, Ph.D. Mary K. Goldstein, M.D.
Acknowledgements • Partial funding was through a grant from the National Cancer Institute (2PO1 CA 55112-05A1). • Dr. Goldstein’s contribution was informed in part by work conducted with a grant from the National Institute on Aging (R01 AG15110). • David Meltzer, Jodi Prochaska, Lisa Faulkner, and Stanford University seminar participants provided helpful comments.
Outline of the Talk • Background on cost-effectiveness analysis (CEA) • A bias in CEAs for behavioral interventions • How to fix the problem • Example • Study design consideration
Economic Evaluations • Most trials don’t include economic analysis • Economic analysis in only 0.2% of 50,000 trials conducted between 1966-1988 • Adams et al. Medical Care 30(3):231-43 • Economic analysis in randomized clinical trials is increasing
Dollars and Sense • Economic studies inform decisions • formulary • adoption of new technology • scope of benefits • strategies for management of care • organization of health care
Cost Effectiveness Ratio Where C1 is the average cost of the intervention group C0 is the average cost of the control group E1 is the average effectiveness of the intervention group E0 is the average effectiveness of the control group
Standardization • USPTF guidelines (Gold et al., 1996; summarized in three JAMA articles) • Drummond et al. (1997) • Created, along with journal editors, standards for both • Methods • Reporting
Whose Costs? • Guidelines recommend a societal perspective for costs • Include • Provider • Payer • Patient
Effectiveness • Guidelines recommend QALYs • Values both quality and quantity of life • Each year of life is multiplied by a weighting factor (utility) • Utilities measure the preference of different health states on a 0-1 scale
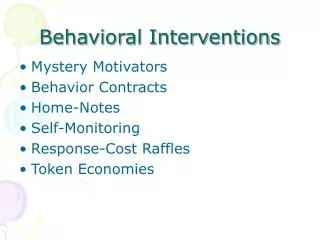
Behavioral Interventions • CEA framework holds, but caveats… • Behavior change is a “slow” process • Treat many to prevent a few • Use of intermediate outcomes (proxies)
Intermediate Outcomes • Outcome is clinically relevant and predicts mortality or morbidity • Receipt of a mammogram • Substance use abstinence • Change in dietary fiber • QALYs would require huge and/or very long studies
CEA with an Intermediate Outcome • Sufficient for publication • Hard to interpret ICER • Can’t easily compare two CEAs with different intermediate outcomes • Can’t compare CEA to other CEA from another clinical area • Sometimes only feasible approach
CEA with QALYs • Measure QALYs or • Translate intermediate outcome to QALYs • Either build a model de novo or use an existing model • Requires a lot of resources • Most useful, but most challenging
CEA and Behavior Change • CEA analysts treat behavior change as a dichotomous outcome • Partial behavior change is not the same as no behavior change • “Getting the person to recognize that they have a problem is half the battle.”
What’s Missing? • Partial behavior change is missing from current models • People who progressed in their process of changing their behavior but did not successfully change their behavior at the end of the study (Stages of Change)
Partial Behavior Change • All behavioral interventions yield some partial behavior change • Amount depends on • the duration of the study • baseline stage of change
Partial Behavior Change Should we and can we value partial behavior change in a CEA?
NO Intentions are not the same as observed behavior change Stage of change is flawed Too difficult YES Behavior change takes time Unobservable differences exist Future benefits are important Otherwise favors med/surg tx Should We?
Can We? • Behaviors are like “value chains” • A series of linked processes • Interventions may be designed to improve a link (stage-matched design) • Matching chemotherapy protocol to cancer stage • Interventions may have differential effects on different links • Stages of Change (TTM) Model by Prochaska and DiClimente
Stages of Change • People progress through successive stages until they change their behavior • Precontemplation: no self-recognition of a problematic behavior. • Contemplation: self-recognition of a problem without action. • Preparation: Planning to change behavior soon. • Action: In the process of change. • Maintenance: adherence to the new behavior over time. • Art of behavioral interventions is to achieve action, and hopefully maintenance
Stages of Change and CEA • Stages of change is critical for interpreting CEA results • Stage of change may be associated with receptivity or motivation • Intervention effects can vary by stage of change • Incremental cost-effectiveness ratio can vary by stage of change
What’s Needed? • Data on stages of change • Probability of moving from partial to successful behavior change • Note: these probabilities are not observed in the intervention group
Two Step Process • Step 1 • Calculate ICERs by baseline stage of change • This alone can provide much more useful and interpretable information for stage-matched interventions • Step 2 • Estimate probability of people moving into successive stages of change • For example, % moved from precontemplation to contemplation and preparation
Source of the Probabilities • Probabilities from the literature or • The control group (if possible) • Possible when control group gets usual care • If 10% of precontemplators in the control group changed behavior, this is the probability for the model
Randomized Controlled Trial • 2700 participants enrolled in 3 arms • Post card reminder (n=900) • Reminder phone call (n=900) • Personal motivational phone call (n=900) • Sample from managed care plan • Managed care organization wants to know which reminder to use
Report to MCO • MCO should choose between postcard or reminder call
Including Partial Behavior Change • Note motivational call is now most effective overall
No single strategy is always preferred. Motivational call is dominated by reminder call for contemplators and those in action ICERs
Patient Reminders • Mailed reminder vs no reminder for mammography • A meta analysis of 16 studies • US studies Pooled OR=1.48 (participants come from provider files) • Aust / NZ studies Pooled OR=5.57 (participants from voter lists) Wagner TH. The effectiveness of mailed patient reminders on mammography screening: a meta-analysis. Am J Prev Med. 1998;14(1):64-70.
CEA and Stage of Change • Fishman P. et al. Cost-effectiveness of strategies to enhance mammography use. Eff Clin Pract. 2000 • Compared three alternative methods for increasing mammography screening • Reminder postcard • Reminder call • Motivational call
Fishman’s (2000) results • ICER varied by prior mammography status (i.e., maintenance)
Feeling Lucky? • The implications of a CEA should not vary by who enters the trial • Two randomized trials with same intervention • RCT 1: all participants are in preparation • RCT 2: all participants are in precontemplation
Clinical Trial Design • If the effect of the intervention might vary by stage of change • Qx: Enroll people from all stages? • Enroll sufficient numbers in each stage • Protect randomization
Conclusions • Subgroup analysis by stage of change may be critical for interpreting the CEA • Partial behavior change is important and can affect interpretation • These methods are appropriate for stage-matched studies • Need to consider study design implications