Download

1 / 11
110 likes | 242 Views
Geospatial & Applied Technologies. Using 3D Demographics Analysis In Transit Planning & Design. 10.16.2013 GIS in Transit Conference Presentation Brian Reed , MCSE, CCNA, CCNP Ryan Avery, PE, AICP, GISP Gabriel Borroni, GISP. Agenda. Why focus on demographics Data views

E N D
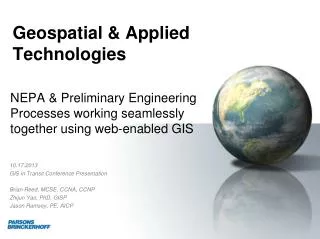
Geospatial & Applied Technologies Using 3D Demographics Analysis In Transit Planning & Design 10.16.2013 GIS in Transit Conference Presentation Brian Reed, MCSE, CCNA, CCNP Ryan Avery, PE, AICP, GISP Gabriel Borroni, GISP
Agenda Why focus on demographics Data views Processes & Methods Overview Samples
Why focus on demographics • Business focus on if or where to open stores • Product inventories • Demographics analytics are a foundation for: • Elected officials win/loss • Projects approved/stopped • Funding increases approved/stopped • Service/ridership performance • Services improvements • Route changes • Route schedules • Capturing additional market-share
Big Data Analytics • Demographic datasets • Census • Ridership studies • Surveys • Trip data • Machine logic to analyze video feeds • Store and analyze from geodatabase
Key data views or datasets Assets Services/Ridership Ridership profile by route New service by user group Service changes by user group Demographics Transit dependency User groups by route Ridership peak by route/day Mobility requirements Walkability • Asset Management Overlay • Service profiles • Modes • Routes • Schedules • Maintenance Yards • Evacuation Routes • Service impedances • Incidents • Construction • Weather impacts
3D Demographics Analysis • GeoDB design & integration • Population density growth • Transportation model output aligned to TAZ’s • Route Service Alternatives • Enables stakeholders to visualize from one common dataset • More readily understand constraints and interact with dynamic view of data
3D Demographics Analysis • GeoDB design & integration • Collected building footprints • Overlay with census and ridership data • Overlay with route and service plans to optimize service/market capture • Analyze over time once service begins • Colors depicting potential customer base
Route Demographics • GeoDB design & integration • Custom developed Geoprocess tools • Station catchments • Demographics data on service use • Route analysis on preferred service • 3D catchments prepared for community workshop • 3D ArcScene model files prepared for meeting
3D Metro Ridership • GeoDB design & integration • Custom geoprocess tools to evaluate and display selected ridership characteristics for service planners • Route and service analytics prove justification for service changes/ enhancements • Public and elected officials can see the same views and common data analysis
Transit Service Time-slider • GeoDB design & integration • Custom developed GeoTools (3 Modules – 4 tools) • Tool evaluates and provides Conflict Alerts service planners or managers/operations, external agencies to alert on construction impacts, route closures, incidents or requested permits against transit service impacts from demographics overlay • Helps provide viable route alternatives and potential ridership impacts
Q&A • Contact information: • Brian Reed • 410-385-4175 • reedb@pbworld.com