Download
1 / 25
250 likes | 334 Views
Explore the growth of information consumption by Americans, from bytes to words. Learn about media types, delivery modes, and factors influencing information expansion. This study delves into TV shows, print media, computer games, and the impact of technology on information access.

E N D
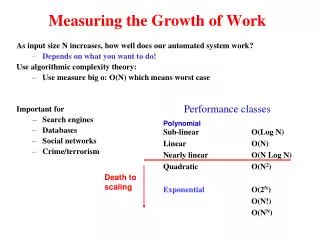
Measuring the Growth of Work Death to scaling • As input size N increases, how well does our automated system work? • Depends on what you want to do! • Use algorithmic complexity theory: • Use measure big o: O(N) which means worst case • Important for • Search engines • Databases • Social networks • Crime/terrorism Performance classes Polynomial Sub-linear O(Log N) Linear O(N) Nearly linear O(N Log N) Quadratic O(N2) Exponential O(2N) O(N!) O(NN)
How Much InformationReaches Americans Consumers? • Roger Bohn - Rbohn@ucsd.edu • HMI? Project -- Global Information Industry Center (GIIC) • UC San Diego • November 3, 2009
HMI? 2009 Scope • Consumers - Information used by Americans 1960 to 2008 • Enterprise - Information processed by servers worldwide in 2008 • Special studies, such as • Scientific data at MIT - giic.ucsd.edu • Health-care data • Enterprise storage growth
Defining “information” • Dozens of definitions (more than one per person!) • Information to consumers ≃ Data that is directly for people • Information supplied versus consumed • Whether they pay attention or not (multiple streams count fully) • Multiple metrics for measuring an information object • Bytes: emphasizes moving visual imagery InfoC • Words: ignores pictures InfoW
How many bytes in a 20 minute TV show? • Raw bytes = Screen size in pixels x bytes per pixel x frames per sec. • 1920 x 1080 x 3 x 30 = 186 Megabytes per second = 1.5 Gbps • TV compressed down to 1 to 2% e.g. 12 Mbps • Infocompressed counts “bytes through the cable” • Examples: SDTV ~ 4 Mbps = 2 GB per hour • Book = 12 bytes per word x 4 words per second = 400 bps
How do we consume information? Infow Infoc Source: HMI? 2009
Computer games ubiquitous • 35 M consoles sold in 2008; 10M Nintendo DS + 10 M Wiil • 70% of online adults play computer games • 7 of top 10 iPhone apps are games (by revenue)! • “Casual gaming” has removed gender bias
Sub-categories: computer games Full calculations go deeper: types of users, types of games, compression factors, others
Detail, fluid animation, lighting, good AI. This is from Xbox version - PC graphics better
Slices: How is info delivered? Airwaves includes TV broadcast, radio, mobile; Wires includes Cable TV, Internet; Physical = Print + Local computer
Other use Slices • “Interactive” information = telephone, computer games • now 55% of InfoC, 36% of InfoW • Traditional media = Cable TV, broadcast TV, radio, movies, print • Now now 36% of InfoC, 56% of InfoW • Define groupings of media types and information measures
What about Information Growth? • As costs fall, use increases. • Hypothesis: • ~ 35% per year growth in InfoC Incorrect!
slow Growth Source: HMI? 2009
Decomposing growth 1960-1980 • InfoC = (# Users) x (Average InfoH per user) x (Average bpsC)x 3600/8 • ∆InfoC = ∆Population + ∆(InfoH per capita) + ∆bpsC • Where ∆Y = (dY/dtime)/ Y = % rate of change of Y • 5.4% = 1.0% + 1.6% + 2.8% • = Population growth + Hours/person growth + InfoC intensity growth • Why did average bits per second only grow at 2.8% per year?
Why such slow growth? • TV penetration ~97% in 1980 • Hours per day: 7.4 in 1980 • 11.7 in 2008 • Intensity: 2.9 Mbps in 1980 • 6.5 Mbps in 2008 • TV in 1980: 4 Mbps SDTV • TV in 2008: 4 Mbps SDTV • 12 Mbps HDTV • < 1 Mbps Internet
what’s happened to print media? InfoW distribution across media 2008 • Print media = Magazines + books + newspapers • Print = fastest way to deliver words • Pool: 240 words per minute • 24% of Iwords in 1960; • 9% in 2008 • Web browsing another 28% Print 1980 1960 Television Computer e.g. Web browse Source: HMI? 2009 Telephone has grown in Sharew
Roll your own projections • What happens if cable TV increases bandwidth per channel? TV usage migrates to Hulu? • What if DVR users store 1% of what they watch, at high fidelity, for 2 weeks? • Quality versus quantity trends
Two Categories of Algorithms Lifetime of the universe 1010 years = 1017 sec Unreasonable 1035 1030 1025 1020 1015 trillion billion million 1000 100 10 NN 2N Runtime sec N5 Reasonable N Don’t Care! 2 4 8 16 32 64 128 256 512 1024 Size of Input (N)