Download
1 / 60
620 likes | 660 Views
Learn the essential requirements for obtaining NMR spectra, including sample preparation, instrumentation setup, and sample handling tips to ensure high-quality data. Understand the significance of field strength, homogeneity, and proper positioning of samples. Explore the role of superconducting magnets, RF coils, and shimming coils in enhancing NMR performance. Discover the benefits of spinning samples and maintaining environmental stability. Gain insights into the lock system for field drift correction and noise reduction in NMR experiments.

E N D
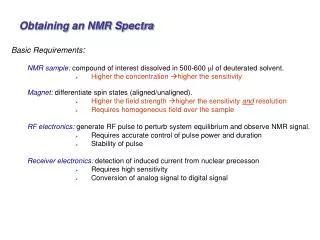
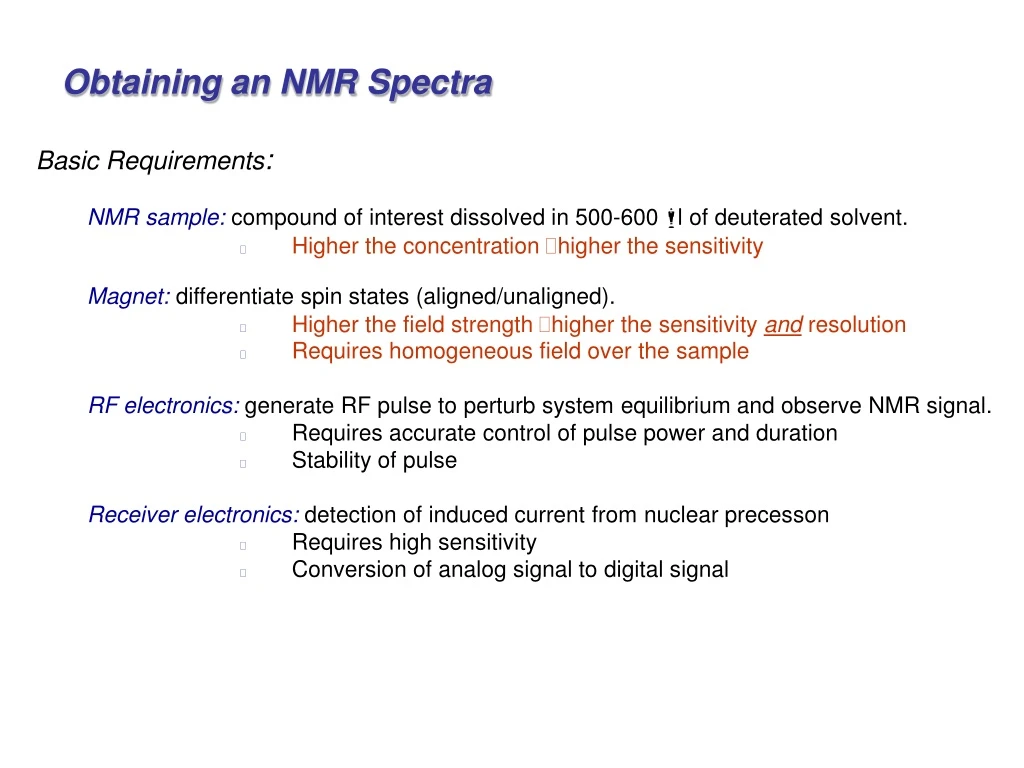
Obtaining an NMR Spectra • Basic Requirements: • NMR sample: compound of interest dissolved in 500-600 ml of deuterated solvent. • Higher the concentration higher the sensitivity • Magnet: differentiate spin states (aligned/unaligned). • Higher the field strength higher the sensitivity and resolution • Requires homogeneous field over the sample RF electronics: generate RF pulse to perturb system equilibrium and observe NMR signal. • Requires accurate control of pulse power and duration • Stability of pulse Receiver electronics: detection of induced current from nuclear precesson • Requires high sensitivity • Conversion of analog signal to digital signal
NMR Sample • Factors to Consider: • Maximize sample concentration • Avoid precipitation or aggregation • Use a single deuterated solvent • Reference for lock • Avoid heterogeneous samples distorts magnetic field homogeneity • Avoid air bubbles, suspended particles, sample separation • Avoid low quality NMR tubes distorts magnetic field homogeneity • Breaks easily damage the NMR probe • Chose appropriate temperature for the sample • Freezing or boiling the sample may break the NMR tube and damage the NMR probe. • Properly position NMR sample in the magnet • Position sample in homogeneous region of magnet and between detection and RF coils • Avoid positioning meniscus close to coil edge distorts magnetic field homogeneity Frequency of absorption:n = g Bo / 2p
Magnetic Field Homogeneity Frequency of absorption:n = g Bo / 2p Good Homogeneity single peak with frequency dependent on Bo Poor Homogeneity multiple peaks at different effective Bo Resonance depends on position in NMR sample
Superconducting Magnet • solenoid wound from superconducting niobium/tin or niobium/titanium wire • kept at liquid helium temperature (4K), outer liquid N2 dewar • 1) near zero resistance minimal current lose magnet stays at • field for years without external power source Cross-section of magnet magnet spinner sample lift NMR Tube RF coils cryoshims shimcoils Probe Superconducting solenoid Use up to 190 miles of wire! Liquid N2 Liquid He
Shim Coils • electric currents in the shim coils create small magnetic fields which compensate for inhomogenieties in the magnet • shim coils vary in the geometric orientation and function (linear, parabolic, etc) • Z0,Z1,Z2,Z3,Z4,Z5 • X, XZ,XZ2,X2Y2,XY,Y,YZ, YZ2,XZ3,X2Y2Z, YZ3,XYZ,X3,Y3
Shim Coils • Optimize shims by i) minimizing line-width, ii) maximizing lock signal or iii) maximizing FID • Examples of poor line-shapes due to shimming errors
Spinning the Sample • Improves effective magnetic field homogeneity by averaging inhomogeneities in the magnet • Z – shims are also known as spinning shims • Spinning the sample causes symmetric side-bands at intervals related to spinning rate • Non-spinning shims (X,Y) problems • Samples are never spun for multi-dimensional NMR experiments • Creates artifacts streaks or T1 ridges from spinning side-bands and spinning instability Spinning side-bands symmetric about peak
Environment Stability • Changes in the environment during data acquisition may have strong negative impacts on the quality of the NMR data • Common causes of spectra artifacts are: • Vibrations (building, HVAC, etc) • Temperature changes • The longer the data acquisition, the more likely these issues will cause problems • The lower the sample concentration (lower S/N) the more apparent these artifacts will be Noise peaks due to building vibrations
Lock System • NMR magnetic field slowly drifts with time. • Need to constantly correct for the field drift during data collection • c) Deuterium NMR resonance of the solvent is continuously irradiated and monitored to maintain an on-resonance condition • 1) changes in the intensity of the reference absorption signal controls a • feedback circuit • 2) a frequency generator provides a fixed reference frequency for the lock • signal • 3) if the observed lock signal differs from the reference frequency, a small • current change occurs in a room-temperature shim coil (Z0) to create a • small magnetic field to augment the main field to place the lock-signal • back into resonance • d) NMR probes contains an additional transmitter coil tuned to deuterium frequency Lock Feedback Circuit Field Drift over 11 Hrs (~ 0.15Hz/hr
Lock System • Measures the resonance of the deuterated solvent • a number of common solvents (D2O, methanol, chloroform) have known deuterium resonance • Can only lock on one resonance, defined by user. • Multiple deuterium resonances may confuse lock in automated acquisition • NMR sample needs to contain at least 5-10% volume of a deuterated solvent • Maximize lock signal indicates on-resonance • Use lock signal to shim sample • Loss of lock during experiment is problematic data not reliable • NMR sample degraded • Instrument problem • Started with weak lock signal • Increase lock signal by increasing lock gain • Amplification of the detected lock signal • Increases both signal and noise, so higher lock gain noisier lock signal • Increase lock signal by increasing lock power • Strength of RF pulse to detect lock signal • Too high and lock signal is saturated intensity of lock signal fluctuates up and down • Too low and lock signal may not be observable Lock Changes From Off-resonance to On-resonance
Sample Probe • Holds the sample in a fixed position in the magnetic field • Contains an air turbine to spin, insert and eject the sample • c) Contains the coils for: • 1) transmitting the RF pulse • 2) detecting the NMR signal • 3) observing the lock signal • 4) creating magnetic field gradients • Thermocouples and heaters to • maintain a constant temperature
Tuning the Probe • Placing the sample into the probe affects the probe tuning • Solvent, buffers, salt concentration, sample concentration and temperature all have significant impact on the probe tuning • Probe is tuned by adjusting two capacitors: match and tune • Goal is to minimize the reflected power at the desired frequency • Tuning capacitor changes resonance frequency of probe • Matching capacitor matches the impedance to a 50 Ohm cable Power submitted to transmitter and receiver is maximized
Tuning the Probe • Side Notes: Impedance and Quality factor (Q) • Impedance – any electrical entity that impedes the flow of current • a resistance, reactance or both • Resistance – material that resists the flow of electrons • Reactance – property of resisting or impeding the flow of ac current or ac voltage in inductors and capacitors • Illustration of matching impedance • Consider a 12V car battery attached to a car headlight • 12V car battery – low impedance high power • Consider 8 1.5V AA batteries (12 volt total) attached to a very low wattage light bulb • 8 1.5V AA batteries – high impedance low power • Now swap the arrangement What happens? • Car battery can easily light the light bulb, but the headlight will quickly drain the AA batteries poor impedance match
Tuning the Probe • Side Notes: Impedance and Quality factor (Q) • “Q” - dimensionless and important property of capacitors and inductors • Q - frequency of the resonant circuit divided by the half power bandwidth • All inductors exhibit some extra resistance to ac or rf • Q is the reactance of the inductor divided by this ac or rf resistance • NMR probes Q > 300 • Higher the probe Q the greater the sensitivity • High Q for an NMR probe is required for high Signal-to-Noise • Sample can effect the Q of the probe • The sample increases losses in the resonant circuit by inducing eddy currents in the solvent • The more conductive the sample the more the losses and the lower the probe Q. • Water, high salt lower the Q of the probe • Lower Q longer pulse widths
Pulse Generator & Receiver System • Radio-frequency generators and frequency synthesizers produce a signal of essentially a single frequency. • RF pulses are typically short-duration (msecs) • 1) produces bandwidth (1/4t) centered around single frequency • 2) shorter pulse width broader frequency bandwidth • i. Heisenberg Uncertainty Principal:Du.Dt ~ 1/2p • 3) Shortest pulse length will depend on the probe Q and the sample property * = tp Pulse length (time, tp) FT A radiofrequency pulse is a combination of a wave (cosine) of frequency wo and a step function The Fourier transform indicates the pulse covers a range of frequencies
Maximum affect Null, no affect Invert signal, 180o pulse • Pulse Generator & Receiver System • RF pulse width determines band-width of excitation • 1) Not a flat profile • 2) All nuclei within ±1/4PW Hz will be equally affected • 1H 6 ms 90o pulse ±41666 Hz ±69.4 ppm at 600 MHz • Minimizes weaker perturbations of spins a edges of spectra • 3) There are also null points at ±1/PW Hz where nuclei are unperturbed • 1H 6 ms 90o pulse first null at ±1.67e5 Hz ±277.8 ppm at 600 MHz • These issues become a problem at high magnetic field strengths (800 & 900 MHz) for 13C spectra that that have a large chemical shift range (>200 ppm) • Also, complex experiments (multiple pulses) depend on the accuracy and consistency of pulse widths • Selective pulse long pulse width (ms) narrow band-width.
Pulse Generator & Receiver System • A magnetic field perpendicular to a circular loop will induce a current in the loop. • 90o NMR pulses places the net magnetization perpendicular to the probe’s receiver coil resulting in an induced current in the nanovolt to microvolt range • e) preamp mounted in probe amplifies the current to 0 to 10 V • f) no signal is observed if net magnetization is aligned along the Z or –Z axis Rotates at the Larmor frequency n = gBo/2p
Continuous Wave (CW) vs. Pulse/Fourier Transform • Continuous Wave – sweep either magnetic field or frequency until resonance is observed • absorbance observed in frequency domain • Pulse/Fourier Transform – perturb and monitor all resonances at once • – absorbance observed in the time domain
Continuous Wave (CW) vs. Pulse/Fourier Transform NMR Sensitivity Issue A frequency sweep (CW) to identify resonance is very slow (1-10 min.) Step through each individual frequency. Pulsed/FT collect all frequencies at once in time domain, fast (N x 1-10 sec) All modern spectrometers are FT-NMRs
Continuous Wave (CW) vs. Pulse/Fourier Transform • Fourier Transform NMR • Observe each individual resonance as it precesses at its Larmor frequency (wo) in the X,Y plane. • Monitor changes in the induced current in the receiver coil as a function of time. FID – Free Induction Decay Increase signal-to-noise (S/N) by collecting multiple copies of FID and averaging signal. S/N r number of scans %
Fourier Transform NMR • Signal-to-noise increases as a function of the number of scans or transients • Increases data collection time • There are inherent limits: • Gain in S/N will eventually plateau • The initial signal has to be strong enough to signal average. % S/N r number of scans
Fourier Transform NMR • Recycle time (D1) – time increment between successive FID collection • Maximum signal requires waiting for the sample to fully relax to equilibrium (5 x T1) • T1 – NMR relaxation parameter that will be discussed in detail later in the course • Most efficient recycle delay is 1.3 x T1 • Typical T1’s for organic compounds range from50 to 0.5 seconds • T1 relaxation times also vary by nuclei, where 13C > 1H • Either estimates from related compounds or experimental measurements of T1 is required to optimize data collection especially for long data acquisitions.
Continuous Wave (CW) vs. Pulse/Fourier Transform • Fourier Transform NMR • c) NMR signal is collected in Time domain, but prefer frequency domain • d) Transform from the time domain to the frequency domain using the Fourier • function Fourier Transform is a mathematical procedure that transforms time domain data into frequency domain
Sampling the NMR (Audio) Signal • a) Collect Digital data by periodically sampling signal voltage • ADC – analog to digital converter Continuous FID Digitized FID
Sampling the NMR (Audio) Signal • b) To correctly represent Cos/Sin wave, need to collect data at least twice as fast • as the signal frequency • c) If sampling is too slow, get folded or aliased peaks The Nyquist Theorem says that we have to sample at least twice as fast as the fastest (higher frequency) signal. Sample Rate - Correct rate, correct frequency SR = 1 / (2 * SW) • ½ correct rate, ½ correct frequency Folded peaks! • Wrong phase! SR – sampling rate SW – sweep width
Sampling the NMR (Audio) Signal Sweep width (Hz, ppm) needs to be set to cover the entire NMR spectra Sweep Width (range of radio-frequencies monitored for nuclei absorptions) If SW is too small or sampling rate is too slow, than peaks are folded or aliased (note phase change)
Sampling the NMR (Audio) Signal Correct Spectra Spectra with carrier offset resulting in peak folding or aliasing The phase of folded peaks can vary: (a) negative phase, (b) dispersive or (c) positive phase.
Sampling the NMR (Audio) Signal • NMR data size • Analog signal is digitized by periodically monitoring the induced current in the receiver coil • How many data points are collected? • What is the time delay between data points? • How long do you sample for? • Sample too long collecting noise & wasting time • Sample too short don’t collect all the data & lose resolution All this noise added to spectra FID signal is truncated Higher Digital Resolution requires longer acquisition times
TD Dwell time DW • Sampling the NMR (Audio) Signal • NMR data size • c) Digital Resolution (DR) – number of Hz per point in the FID for a given spectral width. • DR = SW / TD • where: • SW – spectral width (Hz) • TD – data size (points) • d) Dwell Time (DW) – constant time interval between data points. • SW = 1 / (2 * DW) • e) From Nyquist Theorem, Sampling Rate (SR) • SR = 1 / (2 * SW) • f) ALL Dependent Valuables
TD Total Data Acquisition Time (AQ): AQ = TD * DW= TD/2SWH Should be long enough to allow complete delay of FID Dwell time DW • Sampling the NMR (Audio) Signal • NMR data size • Two Parameters that the spectroscopist needs to set • SW – spectral sweep width • Should be just large enough to include the entire NMR spectra • TD – total data points • Determines the digital resolution • Contributes to the total experiment (acquisition time) • Should be large enough to collect entire FID
Sampling the NMR (Audio) Signal • NMR data size • Increase in the number of data points increase in resolution • Increases acquisition time Increase in data points, resolution and acquisition time
FT • Sampling the NMR (Audio) Signal • NMR data size • Under sampling the data truncated FID • Baseline distortions sinc wiggles Sinc wiggles
Sampling the NMR (Audio) Signal • Adjusting the Receiver Gain (RG) – electronic amplification of the signal • There is an optimal setting guided by the limits of the ADC digitizer • FID intensity changes as the number of transients increase during data acquisition Digitizer has a finite data range
Sampling the NMR (Audio) Signal • Adjusting the Receiver Gain (RG) – electronic amplification of the signal • If RG set too high, the digitizer is full and the FID is clipped • Fourier transform of a clipped FID results in sinc wiggles in the spectrum baseline. • If RG is set too low, the spectrum will be noisy. • RG should be set as increments of 2, where there is a maximum limit • RG may be set to higher values, but no effect on the spectra will be observed • RG may be set to non-factors of two, but adjusted to nearest factor of 2.
Sampling the NMR (Audio) Signal • Solvent suppression • solvent concentration is significantly larger than the sample concentration • water is 55M compared to typical mM – mM of compound • strong solvent signal can fill digitizer making it impossible to observe the sample signal • Dynamic range problem • 16K – 32K range of intensities • Need to suppress intense solvent signals with selective saturation pulse • will discuss different NMR pulses in detail latter With Solvent Suppression Without Solvent Suppression
Quadrature detection • a) Frequency of B1 (carrier) is set to the center of the spectra. • Small pulse length to excite the entire spectrum • Minimizes folded noise carrier PW excites a corresponding bandwidth of frequencies carrier same frequency relative to the carrier, but opposite sign.
Quadrature detection • a) Frequency of B1 (carrier) is set to the center of the spectra. • Rate of precession in X,Y plane is related to carrier frequency • Precession is difference from carrier frequency • Possible to have resonances with same frequency but opposite direction carrier same frequency relative to the carrier, but opposite sign. Counter clockwise – magnetization traveling slower than rotating frame Clockwise – magnetization traveling faster than rotating frame
Quadrature detection • b) How to differentiate between peaks upfield and downfield from carrier? • 1)observed peak frequencies are all relative to the carrier frequency • c) If carrier is at edge of spectra, then peaks are all positive or negative relative to • carrier • 1) Excite twice as much noise, decrease S/N How to differentiate between magnetization that precesses clockwise and counter clockwise? PW excites a corresponding bandwidth of frequencies carrier All this noise added to spectra
Quadrature detection PH = 0 B F B Use two detectors 90o out of phase. w (B1) F PH = 90 PH = 0 F B Phase of Peaks are different. PH = 90 F B
Quadrature detection • Use two detectors 90o out of phase. • FT is designed to handle two orthogonal input functions called the real and imaginary component Detector along X-axis (real component of FT) Detector along Y-axis (imaginary component of FT) Phase of Peaks are different allows differentiation of frequencies relative to carrier
Phase Correction of the NMR Spectra Depending on when the FID data collection begins a phase shift in the data may occur. Phase Shift Phase correction of the NMR spectra compensates for this phase shift.
Phase Correction of the NMR Spectra Phase shift depends on the frequency of the signal Phase Shift
Phase Correction of the NMR Spectra Phase Shift Phase Correct Manually adjust zero-order (PO) and first-order (P1) parameters to properly phase spectra.
Phase Correction of the NMR Spectra • What is happening mathematically during manual phasing of an NMR spectra • Fourier transformed data contains a real part that is an absorption lorentzian and an imaginary part which is a dispersion lorentzian • we want to maintain the real absorption mode line-shape • done by applying a phase factor (exp(iQ)) to set F to zero • we are effectively discarding the imaginary component of the spectra
Phase Correction of the NMR Spectra If you “over-phase” the spectra, you get baseline “roll”
Phase Correction of the NMR Spectra • Power or Magnitude spectra • obtain a pure absorption NMR spectra without manual phasing • results in broader spectra that can not be integrated • not a typical or preferred approach to processing an NMR spectra
Zero Filling of the NMR Spectra • Improve digital resolution by adding zero data points at end of FID • essential for nD NMR data • real gain in resolution is limited to zero-filling to 2AQ ( in theory) or ~ 4AQ in practice 8K data 8K zero-fill 8K FID 16K FID 8K zero-filling No zero-filling
Zero Filling of the NMR Spectra • Better example of the resolution gain and benefits of zero-filling NMR spectra 4AQ zero-filling No zero-filling
Applying a Window Function to NMR data • Emphasize the signal and decrease the noise by applying a mathematical • function to the FID. • b) Can also increase resolution at the expense of sensitivity • c) Applied to the FID before FT and zero-filling Good stuff Mostly noise Resolution Sensitivity F(t) = 1 * e - ( LB * t ) – line broadening Effectively adds LB in Hz to peak Line-widths