BASIC NOTATION
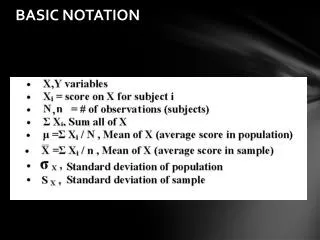
BASIC NOTATION. X i = The number of meals I have on day “ i ” X= 1,2,3,2,1 X i = ??? X i 2 = ??? ( X i ) 2 = ???. Summation (). 9. 19. 81. Nominal Political affiliation Republican Democrat Independent Gender Female Male. Qualitative Variables.

BASIC NOTATION
E N D
Presentation Transcript
Xi = The number of meals I have on day “i” X= 1,2,3,2,1 Xi = ??? Xi2 = ??? ( Xi)2 = ??? Summation () 9 19 81
Nominal Political affiliation Republican Democrat Independent Gender Female Male Qualitative Variables
Ordinal Categories have relative value/order Example Very Depressed Depressed Slightly depressed Not depressed Quantitative Variables
Interval Categories have relative value/order Difference in measurement = Difference in characteristic Example Temperature Fahrenheit, 83,84,85 … Difference from 83 to 84 = Difference from 84 to 85 Quantitative Variables
Ratio Categories have relative value/order Difference in measurement = Difference in characteristic True zero (0) point exists Example Temperature Kelvin, 0,1,2,…343,345,346 … Height 0 inches, 1 inch, …. 86 inches (Shaq) Quantitative Variables
Tables Ungrouped (list of scores) Grouped (grouped by ranges) Graphs histograms frequency polygons Frequency Distributions
The variable: Time (in minutes) between getting out of bed this morning and eating your first bite of food. Time (min) Ungrouped : (6, 28, 27, 7, 7, 24, 39, 55, 13, 17, 13, 13, 3, 23, 18, 37, 2, 8, 11, 18, 22, 2, 21, 31, 12) Table Distributions Bad Grouped Frequency DistributionXf 0-10 7 11-20 8 21-30 6 31-40 3 41-50 0 51-60 1 25 Good Grouped Frequency DistributionXf1-10 7 11-20 8 21-30 6 31-40 3 41-50 0 51-60 1 25
Modality - Peaks Symmetry – Mirror Reflection Asymptoticness – Extreme Values on both Sides Distribution Characteristics
USA Unimodal Symmetric Asymptotic Normal Distributions
Inflection points Where curve changes from convex to concave or concave to convex Also = 1 standard deviation from the mean
CENTRAL TENDENCYWHAT IS A TYPICAL SCORE LIKE? Mode: Most common value; number of peaks; always an observed value Median: Middle of distribution; not affected much by outliers Mean: Average; greatly affected by outliers
CENTRAL TENDENCYModes • Most common score(s) 1,2,2,2,3,4,5,6,7 Unimodal Mode=2 1,3,3,4,4,5,6,7,8 Bimodal Modes=3,4 1,3,3,4,4,5,6,6,8 Trimodal Modes=3,4,6 1,2,3,4,5,6,7,8,9 Amodal
Modes in Populations • Unimodal • Bimodal • Trimodal • Amodal ?
CENTRAL TENDENCYMedians • Middle score in distribution • Odd number of scores 5-point data set: 2,3,5,9,12 Median=5 1,2,5,5,7,9,500,700,999 Median=? • Even number of scores 4-point data set: 3,5,8,9 Median=(5+8)/2=6.5 1,2,5,5,7,9,500,700,999,1122 Median=?
How different are scores from central tendency? Range Standard Deviation The Spread of Distributions
Highest value – Lowest Value Affected only by end points Data set 1 1,1,1,50,99,99,99 Data set 2 1,50,50,50,50,50,99 Measure of SpreadRANGE
How different are scores from central tendency? Always, by definition of the mean The Spread of Distributions
Sample Variance and Standard deviation Also known as “Estimated Population Standard Deviation”
Sample Variance and Standard deviation Why do we use N-1 for sample? Because sample means are closer to sample mean than to population mean, which underestimates the estimate Population 2,4,6,and 8, σ = (2+4+6+8)/4 = 5 Scores 2 and 6 σ2= (2-5)2 +(6-5)2 = 9 + 1 = 10 Scores 2 and 6, = (2+6)/2 = 4 S2= (2-4)2 +(6-4)2 = 4 + 4 = 8 N-1 adjusts for bias
Sample Variance SUM OF SQUARED DEVIATIONS DEGREES OF FREEDOM STANDARD DEVIATION
Differences BetweenSample and Population Standard Deviation 1) Sigma vs. S 2) Population mean versus Sample mean 3) N vs. N-1
Super Important Relationship Standard Deviation is square root of variance SAMPLE STANDARD DEVIATION = SQUARE ROOT OF THE SAMPLE VARIANCE POPULATION STANDARD DEVIATION = SQUARE ROOT OF THE POPULATION VARIANCE