Download
1 / 12
120 likes | 254 Views
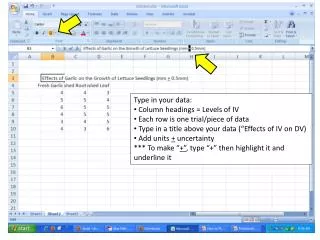
Type in your data: Column headings = Levels of IV Each row is one trial/piece of data Type in a title above your data (“Effects of IV on DV) Add units + uncertainty *** To make “ +” , type “+” then highlight it and underline it. To fix column headings:

E N D
Type in your data: • Column headings = Levels of IV • Each row is one trial/piece of data • Type in a title above your data (“Effects of IV on DV) • Add units + uncertainty • *** To make “+”, type “+” then highlight it and underline it
To fix column headings: • Highlight and right-click to “format cells” • Under “Alignment”, check the box for “wrap text” • Click “OK”
To fix your title: • Click on the cell and line up your mouse until it becomes a skinny “+” sign • Left- click and hold while dragging across several columns • Click “Merge and Center” (the little “a” button) • Click “OK” when the warning box pops up • *** You might have to “wrap text” like in the previous slide if your title is too long
*** You will probably have to resize the row height. Do this by clicking and dragging it down to the right height.
To add basic stats: • Type in “AVE” and “SD” as 2 rows to the side of your table • Click in the cell below your first column, type “=“ and find “average” in the drop-down menu. • When it pops up, highlight your data in that column. • Click “OK”
To add basic stats: • Click in the cell below your AVE, type “=“ and find “stdev” in the drop-down menu. • When it pops up, highlight your data but do NOT include the average • Click “OK”
Highlight both cells and move your mouse to the corner until it becomes a skinny “+” sign • Left-click and drag to the right under each column • OR just repeat the process for calculating the AVE and SD for each column
Decrease decimals by highlighting cells and clicking above. For AVE and SD, you may carry 1 decimal place beyond what you measured.
Alignment: • To center data, highlight cells and click center for “alignment” • Highlight and move your “AVE” and “SD” to the right of the cells
Bold: • Highlight data that’s important (title, column headings, AVE and SD) and make it bold so it stands out
To add borders: • Highlight data and click on which borders you want • You can do “all borders” or get a little fancier if you want- just do let anything distract from your data
YAY! You’re finished! Now it’s time for a graph…