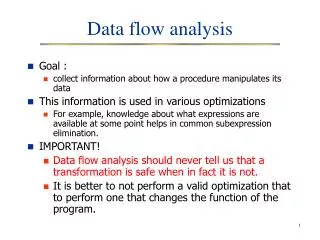
Download

1 / 44
440 likes | 553 Views
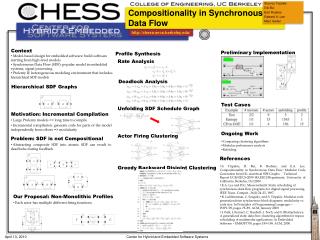
This presentation explores the modeling and analysis of printer data paths using Synchronous Data Flow Graphs (SDFG) within the Octopus framework. It discusses the challenges in translation procedures, completed objectives, and future goals of the Octopus project led by Océ and ESI in collaboration with various Dutch academic groups. The presentation highlights tools used, conceptual architectures, and methodologies for analyzing data flows and printer functionalities. Emphasis is placed on enhancing throughput and optimizing design parameters for efficient printing processes. ###

E N D
Modeling and Analysis of Printer Data Paths using Synchronous Data Flow Graphs in Octopus Ashwini Moily Under the supervision of Dr. Lou Somers, Prof. Dr. Twan Basten, Dr. Nikola Trčka
Outline of the presentation Introduction Octopus Problem Statement Tools used Translation procedures Issues with translation Completed objectives Planned objectives
Introduction Octopus Problem Statement Tools used Translation procedures Issues with translation Completed objectives Planned objectives
Introduction Research is carried out at Océ and ESI Part of the Octopus project Joint collaboration between Océ, ESI and several other Dutch academic research groups.
Image pipelines for different use cases Printer Data flow path DF scanner Datapath Print imageQuality Cost price print process Time to market design finisher Features network Productivity (speed) paper trays Figure 1: Data flow in a printer at Océ Courtesy: Océ Technologies B.V
Introduction Octopus Problem Statement Tools used Translation procedures Issues with translation Completed objectives Planned objectives
Octopus Application Platform Mapping Analysis Diagnostics Figure 2 : The Y- chart[1] • Early design decisions • Design Space Exploration • Model driven approach • Y- chart methodology
Octopus Figure 3a : Conceptual architecture of the integrated framework in Octopus
Octopus toolset Figure 3b : Architecture of the toolset in Octopus
Introduction Octopus Problem Statement Tools used Translation procedures Issues with translation Completed objectives Planned objectives
Problem description Figure 4 : Architecture of the toolset in Octopus
Problem Statement RASDF graph DSEIR model Figure 5 : Translation to be achieved • Conservative translation w.r.to throughput • Guaranteed worst-case throughput for the given model
Introduction • Octopus • Problem Statement • Tools used • DSEIR • RASDF • SDF3 • ResVis • Translation procedures • Issues with translation • Completed objectives • Planned objectives
DSEIR Application Platform Mapping Analysis Diagnostics Figure 6 : The Y- chart[1] • Design Space Exploration Intermediate Representation • Modeling language used to specify models • Components analogous to Y-chart: • Application • Tasks • Loads / handovers • Platform • Resources • Services • Mapping • Schedulers • Priority
Application Globalvariable Taskguards Task name Task parameters Task Port Value sent over edge Tokens Edgecondition Edge Port condition Binding expression Figure 7 : Tasks and edges in DSEIR
Platform Name Type of service Speed Capacity Figure 8 : Platform component in DSEIR • Resource • Name • Capacity • Speed • Type of service
Load/ handover • Load : Amount of service required by a particular task • Handover : Amount of service handed over to the subsequent task Amount required Handover Figure 9 : Load perspective in DSEIR
Mapping Fig 11: Schedulers and tasks with priorities Fig 10 :Schedulers and resources for each service • Schedulers : Map services to resources • Priorities : For each task instance • Pre emption : Allowed
Introduction • Octopus • Problem Statement • Tools used • DSEIR • RASDF • SDF3 • ResVis • Translation procedures • Issues with translation • Completed objectives • Planned objectives
RASDF Figure 12 : An example of SDF[3] Resource Aware Synchronous Data flow graphs Allow for design time analysis of multi processor systems
Example of a RASDF graph Fig 13: Example of an RASDF graph
Introduction • Octopus • Problem Statement • Tools used • DSEIR • RASDF • SDF3 • ResVis • Translation procedures • Issues with translation • Completed objectives • Planned objectives
SDF3 Simulation tool used to analyze RASDF/ SDF graphs. Very fast throughput analysis Generates simulation traces ResVis.
Introduction • Octopus • Problem Statement • Tools used • DSEIR • RASDF • SDF3 • ResVis • Translation procedures • Issues with translation • Completed objectives • Planned objectives
Trace file in ResVis Figure 14: Visualization of SDF3 trace files
Introduction Octopus Problem Statement Tools used Translation procedures Issues with translation Completed objectives Planned objectives
Approach used for translation DSEIR RASDF graph DSEIR-RASDF Figure 15 : Translation methodolgy
DSEIR-RASDF • Restrictive subset of DSEIR • 1:1 mapping to RASDF • Features • Application • No edge, port or task condition • No token values • No parameters • No global variables • Platform • Fixed values; no distributions • Mapping • Non-preemption • Static priority • No expressions
DSEIR-RASDF to RASDF • Translation • Application • Tasks Actors • Edges Channels • Ports Input ports • Tokens Rates • Platform • Resources Resources • Mapping • Schedulers (with task and resource information) resource for each task • Priority priority
RASDF to DSEIR-RASDF to RASDF • Testing purposes • RASDF to DSEIR-RASDF • Application • Actors Tasks • Edges Channels • Input ports Ports • Rates of ports tokens on ports • Platform • Resource resources • Mapping • Task + resources schedulers (Assumption : each task has an unique scheduler)
RASDF to SDF3 to ResVis SDF3: Worst case guaranteed throughput for the DSEIR model Visualization of job traces with ResVis RASDF SDF3 ResVis connection in Octopus
Introduction Octopus Problem Statement Tools used Translation procedures Issues with DSEIRDSEIR-RASDF translation Completed objectives Planned objectives
Issues with DSEIR DSEIR-RASDF translation • SDF3: Very fast memory efficient conservative throughput • DSEIR is more expressive than RASDF • Data dependent parameters • Variable load/ actor execution times • Data dependent choices • Data dependent loops • Variable production/consumption rates of data • Scheduling differences
Issues • Data dependent parameters and variable load/ actor execution time • Solution: • No data dependent values • MinMaxExtractor: extract range • Could lead to: non-monotone models
Non–monotone behavior • Variable execution time of actors • Maximum execution time does not guarantee worst case behavior • Detection of this behavior is extremely difficult
Non monotone behavior Figure 16: An example of RASDF
Non monotone behavior • Simulation traces
Issues Not yet solved • Data dependent choices • Selecting one among the choices OR • Executing all choices and comparing throughput behavior • Scheduling differences • Static non-preemptive scheduling • Variable production/consumption rates of data • Worst case behavior • Data dependent loops
Introduction Octopus Problem Statement Tools used Translation procedures Issues with translation Completed objectives Planned objectives
Completed objectives DSEIR-RASDF RASDF SDF3 RASDF DSEIR-RASDF RASDF SDF3 DSEIR DSEIR-RASDF RASDF SDF3ResVis translation that gives a set of models for varying execution times Verify the translation using the different use cases of the printers Use SDF3 to detect non-monotone behavior
Introduction Octopus Problem Statement Tools used Translation procedures Issues with translation Completed objectives Planned objectives
Objectives that are yet to be realized Implement a smart algorithm that detects non monotone behavior using SDF3 without having to search the entire state space. Try to implement an algorithm that will detect non monotone behavior by static analysis of the DSEIR model (without using SDF3) Implement checks to detect the type of models that can or cannot be translated. Extend this further to accommodate more models. Create a plug-in that will read DSEIR models from the editor and directly produce the throughput behavior for the model.