Download
1 / 22
220 likes | 402 Views
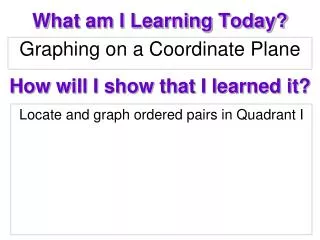
Graphing on a Coordinate Plane. What am I Learning Today?. How will I show that I learned it?. Locate and graph ordered pairs in Quadrant I. Vocabulary. Coordinate plane : Formed by two number lines in a plane that intersect at right angles.

E N D
Graphing on a Coordinate Plane What am I Learning Today? How will I show that I learned it? Locate and graph ordered pairs in Quadrant I
Vocabulary Coordinate plane: Formed by two number lines in a plane that intersect at right angles. Axes: Two number lines in a coordinate plane. X-axis is horizontal and y-axis is vertical. Ordered pairs: Gives the location of a point on a coordinate plane. Coordinate: The numbers in an ordered pair.
Questions Notes Questions Answers How is an ordered pair written? (x, y) What does an ordered pair tell you? The first number tells how far to move right (positive) from the origin along the x-axis. The second number tells how far to move up (positive) from the origin along the y-axis. Where is the origin located? (0,0)
Graphing Ordered Pairs Graph and label each point on a coordinate grid. A. L (3, 5) Start at (0, 0). Move right 3 units. 6 L Move up 5 units. 5 4 3 2 B. M (4, 0) 1 M Start at (0, 0). 0 1 2 3 4 5 6 Move right 4 units. Move up 0 units.
Graphing Ordered Pairs Graph and label each point on a coordinate grid. A. T (2, 6) Start at (0, 0). T 6 Move right 2 units. 5 Move up 6 units. 4 3 2 B. V (5, 0) 1 V Start at (0, 0). 0 1 2 3 4 5 6 Move right 5 units. Move up 0 units.
Try These Give the ordered pair for each point. 1.A 2.B 3.C 4.D Graph and label each point on a coordinate grid. 5.F(7, 2) 6.G(1, 7) (4, 6) G (6, 1) (1, 4) F (2, 1)
February 16, 2011 • Write your homework in your agenda: • Open your agenda to your behavior card. • Open your Homework and Practice workbook p. 49 • Here’s your Warm-up….
Patterns, Tables, and Functions What am I Learning Today? How will I show that I learned it? Analyze and describe patterns arising from mathematical rules, tables and graphs Identify an equation based on a table’s pattern and find the missing values Represent an equation using ordered pairs and translate onto a graph
Questions Notes Questions Answers What is a function? A rule that relates two quantities so that each input value corresponds to exactly one output value. How do I find an equation for a table of values? • Compare x and y values to find a pattern. • Write an equation that fits every pair of values. How do I find the missing values in a table? Use substitution to solve for the missing value
Compare x and y to find a pattern. Use the pattern to write an equation. Substitute 10 for x. Use your function rule to find y when x = 10. Writing Equations from Function Tables Write an equation for a function that gives the values in the table. Use the equation to find the value of y for the indicated value of x. y is 3 times x + 4. y = 3x + 4 y = 3(10) + 4 y = 30 + 4 = 34
Compare x and y to find a pattern. Use the pattern to write an equation. Substitute 10 for x. Use your function rule to find y when x = 10. Writing Equations from Function Tables Write an equation for a function that gives the values in the table. Use the equation to find the value of y for the indicated value of x. y is 2 times x + 4. y = 2x + 4 y = 2(10) + 4 y = 20 + 4 = 24
Direct Variation What am I Learning Today? How will I show that I learned it? Recognize direct variation and describe this proportional relationship using an equation Graph proportional relationships
Questions Notes Questions Answers What is direct variation? When 1 quantity always changes by the same factor as another. The two quantities always have equivalent ratios. (Like equivalent fractions) What does direct variation look like on a graph? A straight line through the point of origin In what 3 ways can direct variation be represented? Table, equation, and graph
y x Determine whether the values in the table represent a direct variation. If so, write a direct variation equation for the variation. If not, explain. 0 0 Direct-Variation Equation Direct Variation
y x Determine whether the values in the table represent a direct variation. If so, write a direct variation equation for the variation. If not, explain. Direct Variation Direct-Variation Equation
y x Determine whether the values in the table represent a direct variation. If so, write a direct variation equation for the variation. If not, explain. The line did not go through the origin! NOT Direct Variation
y x Determine whether the values in the table represent a direct variation. If so, write a direct variation equation for the variation. If not, explain. It is not linear! NOT Direct Variation
22 22 22 22 22 22 22 22 22 22 22 22 22 22 22 22 22 22 22 22 22 22 22 0 0 1 2 3 4 5 6 7 8 9 10 11 12 13 14
Finding the values and graphing using a direct variation equation At a jumping contest, Evan’s frog jumped 60 inches. Isabella’s frog jumped 72 inches. Jake’s frog jumped 78 inches. Use the equation y=12x, where y is the number of inches and x is the number of feet, to find the missing values in the table.
Finding the values and graphing using a direct variation equation There are 60 minutes in an hour. Find a missing values in the table using the direct variation equation y=60x, where x is the number of hours and y is the number of minutes.
Finding the values and graphing using a direct variation equation Tyler rides his bike at a constant speed of 9mph. Complete the table using the equation y=9x, where x is the number of hours and y is the number of miles he travels.
Create a table, write and equation and graph the direct variation • All spiders have 8 legs. Therefore, 2 spiders have 16 legs, 3 spiders have 24 legs, and so on. • A rose bush grows 3 inches every 4 months. How many inches will it have grown in a year? • Six packs of gum cost $2.00 each. At that rate, how much will 42 packs of gum cost?