Download
1 / 62
640 likes | 906 Views
Lecture Notes ECON 437/837: ECONOMIC COST-BENEFIT ANALYSIS Lecture Six. ECONOMIC VALUATION OF TRADABLE GOODS & SERVICES. Applying the Postulates to Determine Economic Evaluation of Tradable Goods and Services.

E N D
Lecture Notes ECON 437/837: ECONOMIC COST-BENEFIT ANALYSIS Lecture Six
Applying the Postulates to Determine Economic Evaluation of Tradable Goods and Services • The framework for the estimation of economic prices was presented for the case of non-tradable goods. • They are also applicable to the valuation of tradable goods. • The methodology for the estimation of the economic prices of internationally tradable goods and services when there are distortions in their markets is also based on the three postulates. • These distortions may include customs duties on imported inputs of a project or those imported items that the project output will replace or substitute.
Tradable Commodities A good or service is considered tradable when an increase in demand (or supply) by a project does not affect the amount demanded by domestic consumers. • An increase in demand for an IMPORTABLE commodity results in an increase in demand for imports. • An increase in demand for an EXPORTABLE commodity results in a reduction in exports. • An increase in supply of a tradable commodity by a project will cause either a reduction in imports or an increase in exports. An Importable commodity includes imported goods and domestically produced goods that are close substitutes for imported goods. An Exportable commodity includes exported goods and close substitutes for exported goods.
Tradable Commodities (cont’d) • There are usually more internationally traded goods and services than non-traded goods and services in economy. • Smaller countries tend to have more traded goods and services than large countries. Small countries cannot produce many goods and services efficiently. • The public sector tends to produce non-traded goods and services but uses many traded goods and services as inputs. • E.g., when analyzing infrastructure projects that produce domestic services, the techniques for the economic valuation of tradable goods are important for determining the economic cost of inputs to the project.
Project Outputs Inputs Tradable Non-Tradable Tradable Non-Tradable Importable Exportable Importable Exportable Classification of a Project’s Outputs and Inputs
Measuring the Economic Values of Tradable Goods: Four Cases • Economic cost of importable input • Economic value of importable good production • Economic value of export production • Economic cost of exportable input
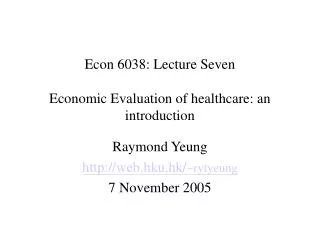
Price S domestic supply Distorted World Supply Price Pm Em* PCIF* (1+Tm) + Fm D domestic demand Quantity per year so do Q Q so do Imports = Q - Q Em= Market Exchange Rate Fm = Domestic Freight to Market Tm = Rate of Import Tariff PCIF= Price of imports at entry point to country, including international freight and insurance charges expressed in units of foreign currency Importable Good
Price S domestic Em * PCIF * (1+Tm) + Fm S world D w/project D domestic Qs0 Qd0 Qd1 Quantity Project Demands More of an Importable Good Project requirements will be met by additional imports (world supply). Domestic consumption is not affected.
Project Purchases Importable Inputs Input subject to Import Tariff D Price 0+P S D 0 0 = Em d w P P (1+t) World Supply After Tariff Em w P World Supply Quantity 0 s Q d d Q Q 0 1 0 Financial cost is EmPw (1+t) (Q1d - Q0d) Economic cost is EmPw(Q1d – Q0d) + Foreign exchange premium
Estimating the Economic Prices of Tradable Goods • 1. Adjust for commodity - specific trade distortions • Financial prices for the commodities demanded (or supplied) by a project must be adjusted for commodity-specific distortions and costs that drive a wedge between their international prices and their domestic market prices. • Taxes and subsidies are transfers between consumers, producers, and the government. Therefore, they are not part of the real resources consumed or produced by a project. • 2. Value the foreign exchange at the economic (shadow) exchange rate (Ee) • Multiply the CIF and FOB prices at the border by the economic price of foreign exchange (Ee). • Alternatively, add a foreign exchange premium [(Ee/Em) – 1], per unit of foreign exchange demanded (or supplied) by a project. • 3. Adjust for handling and transportation costs • The economic costs of handling and transportation that are necessary to move commodities to or from the point of entry must be included. • In the case of imported commodities, these costs should be added to the CIF price. • In the case of exported commodities, these costs should be subtracted from the FOB price.
Visayas Communal Irrigation Project • Basic Facts • The National Irrigation Administration (Philippine National Agency) proposes to rehabilitate 55 damaged communal irrigation systems and to build 25 new systems in Visayas. • The project’s additional components include water protection and erosion control, the strengthening of irrigation association, and the development of agricultural extension services. • The goal of the project is to alleviate poverty, while improving environmental sustainability of the region. • The life of project is 20 years. • The economic benefits arise from the increased production of rice and corn, which must otherwise be imported. • The foreign exchange premium is 24.6%. • The project is expected to cost approximately 480.91 million pesos (US$19.78 million). • The project will be financed with US$15.1 million loan from the International Fund for Agricultural Development, and remaining funding would be provided by the Philippine government.
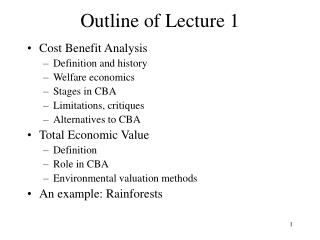
Project uses an Importable Good (Pesticides) (+) (+) (+) Importer Depot, Manila Port, Manila Local Market Farm Transport Transport Transport Tariff, Port Charges
Economic Cost of Importable Goods: With Tariff, Trade Margin and Domestic Freight Em
Measuring the Economic Values of Tradable Goods: Four Cases • Economic cost of importable input • Economic value of importable good production • Economic value of export production • Economic cost of exportable input
Price Sdomestic S w/ project Em * PCIF* (1+Tm) + Fm S world D domestic Qs0 Qs1 Qd0 Quantity Project Supplies More of an Importable Good Project reduces quantity imported. No change in domestic consumption.
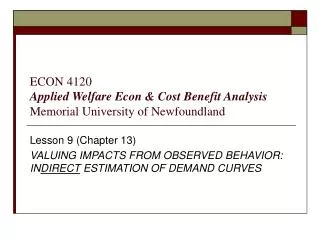
Project Supplies an Importable Good (Rice) Rice Mill (-) Wholesaler, Manila Pre-milled (paddy) Ex-milled (rice) (+) Transportation (-) Paddy equivalent (65%) Milling cost Port, Manila Transportation & handling Trading margin Grain dealer margin Transportation & handling Price of rice at the port Farm Farm-gate price of paddy
Measuring the Economic Values of Tradable Goods: Four Cases • Economic cost of importable input • Economic value of importable good production • Economic value of export production • Economic cost of exportable input
Price S domestic supply Em* PFOB* (1-tx) - Fx Distorted World Demand Price Pm D domestic demand Quantity per year do so Q Q so do Exports = Q - Q Em= Market Exchange Rate tx = Export Tax Fx = Freight and Trading Costs to Port PFOB= Price of exports at point of export from country in units of foreign currency Exportable Good
Price S domestic S w/ Project Em * PFOB * (1-tx) - Fx D world D domestic Qd0 Qs0 Qs1 Quantity Project Supplies More of an Exportable Good Project increases exports. Domestic consumption remains unchanged.
Project Produces Exportable Goods subject toExport Tax (No domestic transportation costs) Em Pd=EmPw(1-t) Financial benefit is EmPw (1-t) (Q1s-Q0s) Economic benefit is EmPw(Q1s – Q0s) + Foreign exchange premium Economic values of exportable goods are based on the FOB values of demand for exports
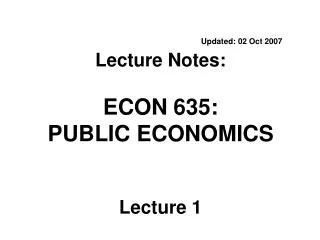
IRRI Supply an Exportable Good (Seeds) (-) IRRI Gate Port Port charges Transportation
Measuring the Economic Values of Tradable Goods: Four Cases • Economic cost of importable input • Economic value of importable good production • Economic value of export production • Economic cost of exportable input
Price S domestic Em * PFOB * (1-tx) - Fx D world D w/ Project D domestic Qd0 Qd1 Qs0 Quantity Project Demands More of an Exportable Good Project requirements will reduce quantity exported. Consumption of previous consumers remains unchanged.
Project Uses an Exportable Good (seeds) (+) Local Market IRRI Exporter (-) (+) TransportationDealer’s margin Transportation Port Handling Transportation Port, Manila Farm
Summary Economic Cost of Imported Input = CIF (adj. for economic exchange rate) + Economic Cost of Freight from Port to Project Economic Value of Importable Good Production = CIF (adj. for economic exchange rate) + Economic Cost of Local Freight from Port to Market - Economic Cost of Local Freight from Project to Market Economic Value of Exportable Production = FOB (adj. for economic exchange rate) - Economic Cost of Local Freight from Project to Port Economic Cost of Exportable Input = FOB (adj. for economic exchange rate) + Economic Cost of Local Freight from Export Producer to Project - Economic Cost of Local Freight from Export Producer to Port
Additional Examples on Calculation of Tradable Goods
Example 1: The Import of Pneumatic Tires (with an import duty)
Non-Tradable Commodities • A good or service is considered non-tradable when its domestic price is determined by local demand and supply. • An increase in demand (or supply) by a project could affect the amounts demanded by domestic consumers (or produced by other suppliers).
Price S domestic supply Distorted World Supply Price Em * PCIF * (1+Tm) + Fm Pm Distorted World Demand Price Em * PFOB* (1-tx) - Fx D domestic demand Quantity per year Defining a Price of Non-Traded Good or Service • Goods and services whose domestic production satisfies all the domestic demand for these items and whose domestic prices are not affected by their world prices are referred to as non-traded goods. Domestic price
Steps to Estimate the Economic Value of a Non-Tradable Good or Service • 1)Adjust for distortions in the market for the item (whether input to, or output of, the project). • Adjustment for distortions in market where demand is being diverted towards or away from (wd). • Correct for distortions in the markets for the inputs used to produce the item. Correction is applied to the proportion of the item produced by other suppliers in the market (ws). • Correct for the foreign exchange premium and the shadow price of non-traded outlays (SPNTO) on tradable and non-tradable components of the non-tradable good or service.
General Formula for the Estimation of the Economic Prices of Non-Tradable Goods and Services This formula can be used to estimate the economic price of a non-tradable good, that is either an input used by a project or an output produced by it.
Step One: Adjusting for Distortions in the Market for Good or Service
Step One: Adjusting for Distortions in the Market for Good or Service Value of postponed consumption Value of additional resources S0 Pz B S0+subsidy C M P1d=P1m (1+tz) L P1s=P1m/(1-kz) G P0d=P0m (1+tz) N J R P0s=P0m/(1-kz) U P1m H D0 E P0m Dn+P Dn A Q1d Q1s Q0 Q2d Qz 0 Economic Costs for Project Input (Input production subsidized and a sales tax is levied on input) Financial Cost is P1m (Q1d-Q1s) Economic Cost is Q1dMGQ0 + Q0RLQ1s Example Wxs = 0.25, Wxd = 0.75, P0m = 90, t = 0.15, k = 0.4 P1s = 90/(1-0.4)=150, P1d = 90 (1+0.15) = 103, Pe = 0.25(150)+0.75(103) = 114
Step Two: Adjustment for distortions in markets where diverted demand moves
d m W P d* x x Step Two: Adjustment for distortions in markets where diverted demand moves • Amount of diverted demand per unit is • Because of increased demand by our project, they will shift their consumption to other goods and services. If these goods and services are taxed at an average rate of d*, the additional taxes will reduce the economic cost of good X. • These additional taxes are denoted as and offset initial cost. • The economic cost of the non-traded good X now becomes: • We should note that the larger is the value of d*, the lower will be the economic cost of a non-traded input used by a project, or the lower will be economic benefit generated by the non-traded output of a project. e s s d d P = W P + W P x x x x x
Step Three: Adjustment for Distortions (Tariffs, Excise Taxes and Subsidies) in the Markets of the Inputs Used in the Production of a Non-Tradable Good Economic Benefits of Project Output (No distortions on output but input market distorted) Price S0 A S0 + Project C P0m E G F P1m B D D0 s1 Q Q0 QT d1 Q Quantity Value of Resources Saved Economic Value = WxsPs+WxdPd If distortions on markets of input then Pd = Pm but Ps < Pm Value of distortions on inputs (taxes) no resource value Value of Increased Consumption
Step Three: Adjustment for Distortions (Tariffs, Excise Taxes and Subsidies) in the Markets of the Inputs Used in the Production of a Non-Tradable Good
Step Three: Adjustment for Distortions (Tariffs, Excise taxes and Subsidies) in the Markets of the Inputs Used in the Production of a Non-Tradable Good (Cont’d) • WsPs might overstate or understate opportunity costs if there are taxes or subsidies on the inputs. • Tradable Inputs • Suppose, in the production of good x, the market of one of its tradable inputs (i) is distorted by an excise tax. • These taxes are not economic costs. • Need to adjust by • = input-output coefficient showing the quantity of (distorted) input i • used in the production of one unit of x • = market price per unit of input i • di = effective rate of tariff, excise tax or sales tax on input i • This correction is equivalent to substituting the economic values of the inputs (excluding the adjustment for the FEP) for their financial values. The expression for this adjustment is written in a more general form in terms of distortions di, as , di has a positive value if it represents an excise tax, sales tax, import tariff or a negative value if the distortion is a subsidy.
Step Three: Adjustment for Distortions in the Markets of the Inputs Used in the Production of a Non-Tradable Good (Cont’d) • Non-Traded Inputs • The fundamental objective is to remove any distortions associated with the non-traded inputs j used to produce a non-traded good X. • Case I: Tax (dj) on non-traded inputs • In the case where there is just a tax on the purchase of input j, the financial cost of the input will be Pjm(1+dj) and the economic cost [WjsPjm + WjdPjm(1 + dj - d*)] where dj is the rate of tax on input j and d* is the average rate of indirect taxes on traded and non-traded goods. In this case, Ps = Pm. • We wish to subtract the financial costs of input j from the supply price of X and then add back j’s economic cost. The adjustment to the supply price of X for the distortions input j is expressed as: • Simplifying this expression, we have to do adjustment for this tax, dj, on j. Hence, the value of the distortion cause by the tax adjustment is:
Step Three: Adjustment for Distortions in the Markets of the Inputs Used in the Production of a Non-Tradable Good (Cont’d) • Case II: Subsidy (kj) and Tax (dj) on non-traded inputs • Suppose instead there is a tax on input of j and also a subsidy on production of j. Hence, Ps = Pm (1 + kj) and Pd = Pm (1 + dj). The adjustment will be: • Hence, the value of the distortion created by the tax and subsidy on non-traded input is:
Step Three: Adjustment for Distortions in the Markets of the Inputs Used in the Production of a Non-Tradable Good (Cont’d) • The distortion of tax and subsidy on non-traded input is: when, dj, a tax on non-tradable input, and d* are both positive that will reduce the economic cost of the final non-traded good X but kj is a subsidy on non-tradable supply of input j which is negative and will, thus, increase the economic cost of the final non-traded good X. • The expression summing up the distortions in the markets for traded inputs i (=1 through n), and non-traded inputs j (= 1 to z) is as follows:
Step Four: Adjust for Foreign Exchange Premium on Tradable Components • There will be a need to adjust the proportion of the tradable components (T) of the non-tradable good by the foreign exchange premium (FEP). This is expressed as follows: • Value of foreign exchange premium (FEP), (FEP = Ee/Em - 1), on the tradable good components of the non-tradable input = [T Pxm FEP)] where: T = proportion of tradable good component of the non-tradable input (x) used by the project expressed as a proportion of the financial market price Pxm Pxm = market price per unit of output x Ee = economic exchange rate Em = market exchange rate