Download
1 / 16
160 likes | 348 Views
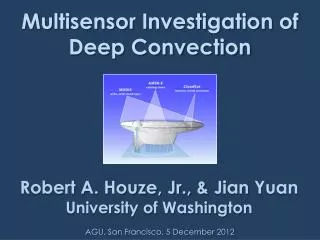
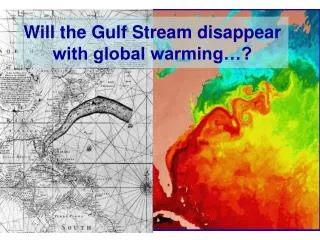
Investigation of deep heating over the Gulf Stream and the linear response. Justin Small Shoshiro Minobe Shang-Ping Xie. Questions. What is the link between the Gulf Stream and deep heating in the atmosphere? and How does it affect the atmospheric, climatological, stationary wave pattern?.

E N D
Investigation of deep heating over the Gulf Stream and the linear response Justin Small Shoshiro Minobe Shang-Ping Xie
Questions • What is the link between the Gulf Stream and deep heating in the atmosphere? and • How does it affect the atmospheric, climatological, stationary wave pattern?
Background • The response of the atmosphere to extratropical diabatic heating, eddy fluxes etc has been studied in may previous papers (Hoskins and Valdes 1990, Held et al 2002, Kushnir et al 2002). • In general these papers assume either a broad diabatic heating pattern (HV) or a shallow distributed diabatic heating(Peng et al papers) • Renalaysis and experimental data (CLIMODE) suggest that diabatic heating may be deep and narrowly confined over the Gulf Stream. How does this change above studies? • Preliminary results discussed below.
ISCCP cloud data ISCCP data (annual climatology) suggests that there is a maximum of low level cloud, and of high level cloud, closely associated with the GS extension and the NAC. (no obvious effect on medium level cloud). ISCCP climatology of cloud amount and cloud classification (low is 680 to 1000mb, middle is 440 to 680mb, high is 440mb to 50mb. Cloud amounts in percentage.
NCEP/NCAR reanalysis fluxes and precip Even the “coarse” resolution NCEP/NCAR reanalysis shows clear signature of GS. Fluxes, annual climatology, from NCEP/NCAR reanalysis. Surface sensible and latent heating (W/m2, top) and precipitation and evaporation rates (bottom, mm/day)
NCEP2/DOE reanalysis NCEP2 reanalysis shows that convective heating extends deep into the free atmosphere. At left: Maps and vertical profiles of annual-mean heating over the Gulf Stream in the NCEP/DOE Reanalysis-2 dataset. Top: Horizontal map at sigma=0.4352 of the combination of deep convection+large scale condensation+shallow convection . Bottom: Vertical profile area averaged over 34:36N, 75:70W. open circles denote heating by deep convection+large scale condensation+shallow convection, closed circles denote dc+lsc, squares denote dc only. The vertical coordinate is 10000 times sigma (=p/p_surface), so that 5000 corresponds to about 500 mb over the ocean, for example.
JRA-25 reanalysis JRA-25 also shows deep heating- vertical profile of total heating below Annual climatology (ignore “Jan” in the titles). Diabatic heating (sum of convective, large scale condensation, diffusive (inc. senible), long wave, and short wave radiation heating) ~Q1. Top left: heating at 850mb. (K/day) Top right: heating at 700mb Bottom left: heating at 400mbBottom right: integrated heating 1000mb to 200mb, W/m^2.
Latent heating derived from TRMM The figure below is from one of the latent heating estimates (actually, Q1-QR) from TRMM (Tao et al 2006, BAMS, 1555- Convective Stratiform Heating product). These products are under constant evaluation – their may be problems with shallow convection in this version. It shows deep heating, but a suspicious “tropical” structure – note that a cloud resolving model is used to provide the vertical structure (I think). CSH latent heating, annual mean, climatology. Left: Horizontal structure of heating rate (K/day, color) at 6km. A nine-point smoother has been applied to the data. Overplotted as contours is the climatology of SST from TRMM TMI data. Right: vertical profiles at selected points – in the Gulf Stream (74.25W, 34.25N, thick), in the subtropics (66W, 26N, dashed), and over land (80W, 34.25N, thin solid). Data extends to 36.25 N only.
Experiment • Let’s use a Linear Baroclinic Model to check the linear response to such diabatic heating fields (a la HoskinsValdes) • Here we do not include the storm track feedback effect (Peng, Robinson et al) • We chose to use the JRA-25 data to provide a vertical structure of heating (for sensible and convective separately), and used an idealised horizontal structure representing GS and extension.
Linear Baroclinic Model • A Linear baroclinic Model of Watanabe and Jin (2000, QJRMS) • Modified from Uni Tokyo Center for Climate System Research AGCM • Linearised about annual mean, zonal mean state of NCEP/NCAR reanalysis. • Used in dry mode: impose diabatic heating, diagnose circulation response. • T42, 20 levels • Time integrated for 24 days
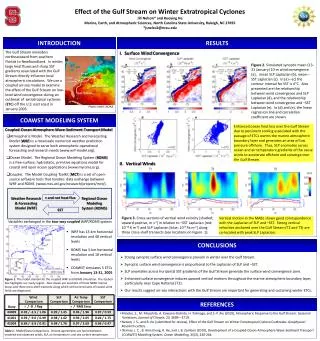
Forcing for model Figure 1. Idealized forcing for model. a) (left). Horizontal structure of idealized forcing: latent heat release (Wm-2, color), and sensible heating (contour, Wm-2, maximum value is 70 Wm-2). b) Right), Vertical structure of heating (normalised): convective (solid) and sensible (dashed).
Near-field response Fig. 1b, c). Near-field geopotential height response (gpm) and wind velocity at 250mb, after 24 days. Left: Convective heating, right: sensible heating.
Far-field response Figure 1e,f. Hemispheric response to heating, geopotential height (gpm) at 250mb. e) Convective heating, contour interval 2gpm. F) Sensible heating, contour interval 0.5gpm.
Total response Atmospheric response at 250 hPa in the Linear Baroclinic Model (LBM): geopotential height(color in m) and stream function (contour in 106 s-1). The atmospheric response to the Gulf Stream heating features positive height anomalies over the mid-latitude North Atlantic and negative anomalies to the north and south, contributing significantly to the westerly jet from North America to Europe. The maximum geopotential height anomaly exceeds 20 m in LBM, a significant fraction of the standard deviation (42 m) of zonal variations of the annual climatology in 35–40N.
Summary • Reanalysis and a merged satellite product suggest that there is deep heating over the Gulf Stream • Observations from CLIMODE also suggest this is true, certainly on synoptic timescales (Jim Edson’s observations.) • The linear response to the total heating is significant. It is also somewhat different to that found by Hoskins and Valdes (part of this due to • different years of analysis, • different seasons, (HV use winter only, we use annual) • different diabatic vertical heating distribution, • different horizontal distribution (HV use whole Atlantic, we use GS only)