Download
1 / 26
270 likes | 449 Views
Teaching Science with Sloan Digital Sky Survey Data. Jordan Raddick The Johns Hopkins University. GriPhyN/iVDGL Education and Outreach meeting March 1, 2002. What is the SDSS?. Project to map the night sky from 9 th to 23 rd magnitude Images of 100 million objects

E N D
Teaching Science with Sloan Digital Sky Survey Data Jordan RaddickTheJohns Hopkins University GriPhyN/iVDGL Education and Outreach meeting March 1, 2002
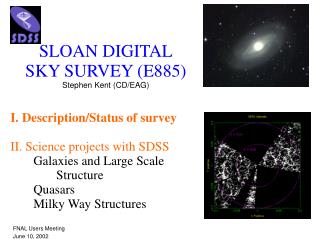
What is the SDSS? • Project to map the night sky from 9th to 23rd magnitude • Images of 100 million objects • Spectra for 1 million galaxies and 100,000 quasars continued
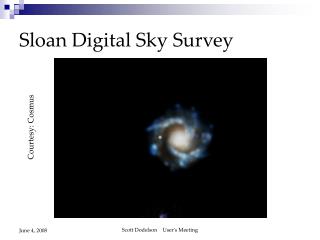
What is the SDSS? • Goal: Create a 3-D map of the universe Image courtesy Adrian Pope, JHU
Data • Images • Magnitudes in 5 wavelengths • Near ultraviolet to infrared • Spectra • Moderate resolution • 3800 to 9200 Angstroms • Survey measures 640 spectra at once
Before the SDSS Star cluster Palomar 5
After the SDSS Star cluster Palomar 5
Accessing the Data • All data available to anyone, free of charge, on the SkyServer web site • http://skyserver.sdss.org
Tools - Navigate • Point-and-click through the sky • Summary of photometric information on each object • Developed by Alex Szalay, JHU and Jim Gray, Bay Area Research Center
Tools – Object Explorer • Information on single objects • Photometric and spectroscopic • Look up by object ID, position, spectral plate/fiber • Correlations to data from other sky surveys
Tools - Query • Search for all objects meeting given criteria • Uses Microsoft Structured QueryLanguage (SQL) • SQL tutorial on site
The Power of SkyServer Richards, et al., Astronomical Journal, 2001 Lauren Saks, freshman creative writing major, JHU • SkyServer gives the public access to real astronomical research Quasars project by Robert Sparks
Educational Projects • Interactive educational projects • Students use real data • Groundbreaking research in classroom • Full lesson plans for teachers
Levels of Projects • For Kids • Basic • Advanced middle school students • High school students • Curious adults • Advanced • Advanced high school students • Introductory level college students • Amateur astronomers
Key Features of Projects • Flexibility • Projects can be done quickly or in-depth, depending on teacher needs • Lessons make extensive use of SDSS data • Research Challenges • Independent follow-up work on projects that interest students • Teacher’s guide and sample responses for all projects • Password protected • Sample responses available on request to students and others doing projects independently continued
Key Features of Projects • Recommended reading materials for teachers • Correlations to National education standards • AAAS Project 2061 Benchmarks for Science Education • NCTM Principles and Standards for School Mathematics
Teacher’s Guides • Teacher’s guides are available for all projects • Correlations to national educational standards • AAAS Project 2061 Benchmarks for Science Education • NCTM Principles and Standards for School Mathematics
Example: Hubble Diagram • 1929 – Edwin Hubble discovers expansion of universe • Foundation of modern astronomy • Students repeat discovery with SDSS data continued
Example: Hubble Diagram • Students calculaterelative distancesto galaxies • Identify galaxiesfrom images • Use severalmethods to finddistances continued
Example: Hubble Diagram • Find redshifts(velocities) from observed spectra • Use sametemplates asSDSS scientists continued
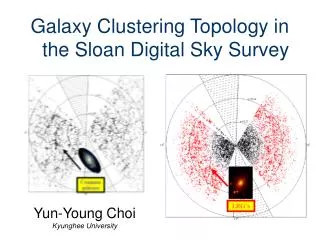
Example: Hubble Diagram • Graph redshift vs. distance • Straight line suggests universe is expanding • Students asked about logic of argument • Over 40,000 galaxies to choose from continued
Example: Hubble Diagram • Teachers’ Guide • Project goals • Knowledge required • Estimated time • Advice on leading classes • Correlations to educational standards
For Kids • Old Time Astronomy • Sketch celestial objects • Scavenger Hunt • Adopt a Galaxy • The Constellation Game Mooseris, the great moose of the sky. A constellation created by Jordan Raddick.
Basic Projects • The Hubble Diagram • Asteroids • Spectral Types • Colors in Astronomy • Galaxy Classification • Sky Surveys
Advanced Projects • Hubble Diagram • Colors in Astronomy • Spectral Types • H-R Diagram • Galaxies • Quasars • Sky Surveys • The Large Scale Structure of the Universe • Image Processing with SDSS Data
The SkyServer Sampler CD-ROM • Background on SDSS • Sample images and spectra • Several sample lesson plans • For free access to all data and lesson plans, visit http://skyserver.sdss.org
Want more information? • Volunteer your classes to test projects • http://skyserver.sdss.org • http://www.sdss.org • E-mail raddick@pha.jhu.edu or rsparks@fnal.gov