Download
1 / 31
310 likes | 408 Views
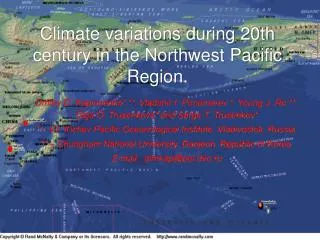
Geophysical observation network of JAMSTEC in Northwest Pacific Region. Seiji Tsuboi , Y. Ishihara, H.Mizutani, H.Nagao, Y.Yamagishi, Y.Yuki IFREE/JAMSTEC. Operation status for BB seismic station. SPVO. PLVO. New(restart) station. New recorder and telemetered station.

E N D
Geophysicalobservation network of JAMSTEC inNorthwest Pacific Region Seiji Tsuboi, Y. Ishihara, H.Mizutani, H.Nagao, Y.Yamagishi, Y.Yuki IFREE/JAMSTEC
Operation status for BB seismic station SPVO PLVO New(restart) station New recorder and telemetered station New recorder and offline station
Network Data Center systembased on web servicesuser interface of each DC is accommodated in WSDL IFREE/JAMSTECDC Data Center B IRIS DMC Users’ PC Data Center D
Summary • Broadband seismogram database http://www.jamstec.go.jp/pacific21/ • Network Data Center system by using web services http://www.jamstec.go.jp/pacific21/ • Earth science data viewer using Google Earth http://www.jamstec.go.jp/pacific21/ • XML SEED for broadband seismograms http://www.jamstec.go.jp/pacific21/xmlninja • XML SEED for synthetic seismograms http://www.jamstec.go.jp/pacific21/ninja_synth
Earth Science data onGoogle Earth • Multi purpose geoscience data viewer • Integration of geochemical and geophysical data. • Efficient use of various format data. • Tool to convert geoscience data to a KML file • We adopted Google Earth.
Target data • Navigation data of JAMSTEC vessels. • Geochemical rock data. • Tomography model data.
Navigation data on Google Earth • Multiple routes. • Detail path. • Information ( contain link to Database ). • Date. • Temperature and sea depth.
Geochemical rock data • PetDB and GEOROC. • Excel file from PetDB. • CSV file from GEOROC.
SiO2 at Pacific Ocean from PetDB Red ~ Blue
Main compositions blue:SiO2, dark blue: TiO2, light green: Al2O3, purple: Cr2O3, green: Fe2O3, dark green: FeO yellow green: MnO, orange: MgO, emerald: CaO, gray blue: Na2O, light blue: K2O, violet: P2O5 black: residual
Geochemical rock data on Google Earth • Color, Height, Thickness of bar graph. • Various composition data. • Shape of bar graph. • Ratio between compositions. • Main compositions. • PetDB + GEOROC.
Tomography model • Text data. • Data file at each depth.
Global tomography model Obayashi et al., 2006
Global tomography model (model information) Obayashi et al., 2006
Vertical cross section Obayashi et al., 2006
Tomography model on Google Earth • Global / Local model. • Information of the model. • A part of original model. • Vertical cross section along any profile. • http://www.jamstec.go.jp/pacific21/
Development of conversion tool • Original data to a KML file. • Navigation data, geochemical rock data and tomography model. • Easy and quick data plotting. • Various data on Google Earth together.
Navigation data • text data $SOJ:+09.0,20030702,220000,W84,GP1,V, 2.2, 6,38-55.76330N ,145-45.50240E ,SC:HYB,G 13.3, $SOJ:+09.0,20030702,220005,W84,GP1,V, 2.2, 6,38-55.74600N ,145-45.49600E ,SC:HYB,G 13.3, $SOJ:+09.0,20030702,220010,W84,GP1,V, 2.2, 6,38-55.72840N ,145-45.49010E ,SC:HYB,G 13.3, $SOJ:+09.0,20030702,220015,W84,GP1,V, 2.2, 6,38-55.71120N ,145-45.48300E ,SC:HYB,G 13.0, $SOJ:+09.0,20030702,220020,W84,GP1,V, 2.2, 6,38-55.69360N ,145-45.47780E ,SC:HYB,G 13.0, $SOJ:+09.0,20030702,220025,W84,GP1,V, 2.2, 6,38-55.67630N ,145-45.47080E ,SC:HYB,G 12.8, $SOJ:+09.0,20030702,220030,W84,GP1,V, 2.2, 6,38-55.65860N ,145-45.46560E ,SC:HYB,G 13.0, $SOJ:+09.0,20030702,220035,W84,GP1,V, 2.2, 6,38-55.64130N ,145-45.45860E ,SC:HYB,G 12.8, $SOJ:+09.0,20030702,220040,W84,GP1,V, 2.2, 6,38-55.62030N ,145-45.45170E ,SC:HYB,G 13.0, $SOJ:+09.0,20030702,220045,W84,GP1,V, 2.2, 6,38-55.60270N ,145-45.44530E ,SC:HYB,G 13.0, $SOJ:+09.0,20030702,220050,W84,GP1,V, 2.1, 6,38-55.58550N ,145-45.43950E ,SC:HYB,G 13.0, $SOJ:+09.0,20030702,220055,W84,GP1,V, 2.1, 6,38-55.56760N ,145-45.43390E ,SC:HYB,G 13.0, ……………………………………………….
SiO2 and Al2O3 at Pacific Ocean Triangle: SiO2 (Red ~ Blue) Hexagon: Al2O3 (Yellow ~ Orange)
Al2O3/SiO2 at Pacific Ocean Blue > 30 %, White < 30 %
Global tomography model (color bar) Obayashi et al., 2006
Local tomography model Isse et al., 2006
Geoscience data on Google Earth S. Tsuboi1、Y. Yamagishi1, H. Tamura1, K. Suzuki1, and H, Yanaka2 1.JAMSTEC 2.Fujitsu