Download
1 / 45
450 likes | 606 Views
A public health perspective on trails and greenways. Towards evidence-based practice Dafna Merom NSW Centre for Physical Activity and Health. Epidemiological questions. Trail / Parks. Physical activity (PA). Health benefits. Mental Health Well being. Chronic disease

E N D
A public health perspective on trails and greenways Towards evidence-based practice Dafna Merom NSW Centre for Physical Activity and Health
Epidemiological questions Trail / Parks Physical activity (PA) Health benefits Mental Health Well being Chronic disease prevention and control Social benefits
The topics of this talk • Health benefits of physical activity • Changes to public health recommendations and to health promotion strategy • Environmental influences on physical activity behaviour • Developing conceptual model guiding the research • Empirical evidence to support the effectiveness of trail/parks • Recommendations for research and practice
Health benefits of physical activity Total mortality PA Bone mass, osteoporosis Prevent falls CVD CHD High BP Obesity Depression Anxiety, stress Enhance mood, well being Blood lipids Colon cancer Diabetes Other cancers?
Public health recommendations • Regular moderate-intensity physical activity • 30 minutes on most, preferably all days of the week. • This amount can be accumulated throughout the day in several short 10-minutes bouts. • This is the minimum required, increase amount result in increase benefits
Public health recommendations linked to obesity epidemic • Consider all opportunity to be active: ‘walk instead of using a car whenever you can’. • Incorporate physical activity into your daily life; in transport, in occupational and domestic settings. • Walking is considered as the most suitable type of activity for widespread promotion.
Percentage of people achieving 150mins/wk of at least moderate physical activity * P<0.01 Source: Bauman et al. Active Australia Surveys, short-term trends
Percentage of people reporting no physical activity (i.e. completely sedentary) Source: Bauman et al. Active Australia Surveys, short-term trends
Long-term trend in past week walking for exercise Source: Merom D. Secondary analyses of the National Health Surveys, ABS.
Getting population to be more active How? Schools Worksites GPs? OR ?
Changes in health promotion strategy • 1986 WHO Ottawa Charter highlighted the role of the environment in influencing people’s health. • Creating supportive environments and building healthy public health policy became two major health promotion strategies. • Development of ‘ecological’ models to health promotion in which the environment is considered as one level of influence.
Changes to physical activity promotion • Much is known about the psychosocial influences on PA. Less is known about environmental influences. • Most PA interventions used educational and cognitive-behavioural approaches aimed at individuals. They only produce short-term effect. • Broader approaches are now advocated • community-based intervention, use of mass media and environmental and policy change.
What empirical evidence do we have to support an ecological approach? • Cross sectional studies (correlates) • Longitudinal studies, including interventions • Planned experiments • Natural occurrence that has been evaluated
What influences walking / cycling trips?Transport and urban planning research • High density – residential or employment (persons per acre/ job per acre) • Greater land use mix – relative proximity of different land uses (shopping, offices education, within a given area ). • High Connectivity – The directness and availability of alternative routes from A to B (street design)
Neighborhoods walkability Proximity (distance) & Connectivity (directness) Land use mix, Residential density
Walking / cycling trips among residents of ‘high’ vs. ‘low-walkable’ neighborhoods N=10 N=2 studies Source: Saelens et al, Ann Behav Med, 2003
Public health research adds to transport research • Broader measures of physical activity (frequency, minutes, walking purposes), validated for population surveys. • Perceived environment: Safety (busy road, crime, unattended dogs) Aesthetic (enjoyable scenery, attractive, pleasant) Quality of facility (lighting, surface, width) Convenient of facilities (easy reach, convenient to walk) • Adjusting for individual and social influences on PA
Findings from public health research • Access to facilities (distance / convenience) was associated with higher usage / higher level of walking/cycling and total PA . • Aesthetic – In Australia was associated with walking for exercise but not for travel. In USA only for travel. • Safety – more walking if busy roads, less if unattended dogs, or feeling unsafe. • Gender differences were noted mainly for safety. • After adjustment to other factors – individual influences stronger association, necessary but not sufficient
What direction ? (cause and effect) ? Environment Physical activity levels OR ? Choose to live in supportive environment, tend to use facilities? Physically active people PA transfer?
Conceptual model guiding next generation of research Factors influencing use Actual trail/park usage B E N E F I T S Individual characteristics PA Who, how much Visiting Access to trail/park Aware? Other recreational activities Trail characteristics and features
Information on usage from other organisationsSydney Urban Park Education and Research Group • Most people visit parks (annually >90% in the past week 56% ) • 1/3 to ½ of visitors use the park for active recreation (mainly walking). Already active? Repeated users? Park users SES, gender age?
Intercept surveys459 visitors of new trail in WV, USA • 78% of trail visitors were ‘regular exercisers’ before visiting the new trail (3 times per week at least 20min). • Most (90%) of new exercisers reported increased in PA since using the trail, whereas 48% if regular exercisers. • New exercisers (22%): • More likely to travel short distance < 5kms • Used the trail as a primary outlet for PA • More likely to walk, less likely to jog • Convenience was rated as the main reason for use of trail • Unsafe conditions emerged as a concern
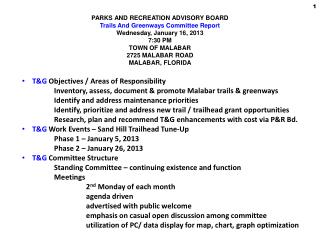
A model project - quasi-experimental (planned experiment) Community A T1 T2 Community B built park/trail Build park T1 T2 • Impact - does park development increase PA in the population (defined) surrounding the park ? • Process – How often park was used ? Were ‘users’ already active in T1? Is it used for active recreation ? Barriers for not using? (perceived safe, aesthetics, convenient) but also objective
San Diego Naval military base Creating supportive environment to enable integrating physical activity to daily routine Quasi-experimental Pre-post assessments of two cohorts in two comparable military base Department of Epidemiology, University of North Carolina The Naval Health Research Center, San Diego Source: Linenger et al. Am J Prev. Med, 1998
Environmental and policy changes • Bicycle paths built along roadways • Women’s fitness center opened • Extended hours at recreation facilities • New equipment for gyms • Base-wide athletic events • Running and bicycling clubs organized
Military base - results • Overall fitness score improved by 16% in the intervention, significantly greater than control. • Improved run time in intervention by 2.4% of the mean time, significantly greater than control. • Inactive group benefited the most (% failed test dropped)
Missouri Walking Trails Community-based intervention using ecological approach Prevention of cardio-vascular disease Quasi-experimental Two population cross sectional surveys School of Public Health, Saint Louis University Division of Chronic Disease Prevention CDC. Missouri Department of Health Source: Brownson et al. Am J Prev Med (2000, 2004)
Approach to reducing inactivity • Selecting communities characterized with no places to walk (no sidewalks, shopping mall). • Walking trails were built in residential parks within city limits, existing trails were upgraded • Most (87%) covered with asphalt or gravel • mean length – 1km (range 0.25km – 4 kms) • Costs between USA $2,000 – $4,000 per trail
Evaluation survey: access, use and effects (trail existence: mean=1.53 yrs range: ½-5yrs) • 36.5% said they had access to trails in their area (awareness!!). • Of those who had access, 40% used the trail. • 55% of trail users perceived that their physical activity increased since use of trail. Brownson et al. Am J Prev. Med, 2000
Second stage – promotion of PA • Building coalitions: community member, heart health coalitions, academic partners, local governments • Events: Walk-a-thons, Family Fun Day • Walking clubs free of charge • Tailored newsletters mailed to individuals. • Some community members received swiped card for tracking their trail use. Data were incorporated to their newsletter.
Post- intervention evaluation surveys intervention communities and controls • Overall no net significant intervention effect on total walking • Subgroups effect: • Less educated (+15min), • Income < 20,000 (+16min) • Living < 5 miles to trail • Over time, trail use doubled • Among trail users only 32% reported an increase in PA since beginning use
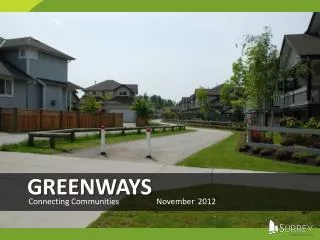
The Conversion of Rail-to-Trail in Western Sydney Longitudinal design A population –based sample according to proximity residents <1.6kms Only cyclist 1.6-5kms SWSAHS and WSAHS epidemiology units Road Traffic Authority (RTA) NSW Health department Merom D et al Prev Med. 2002
16kms long 2.5 m wide
Awareness of Trail by target population Overall 34% who live within 5kms to trail were aware of the new trail
Change in walking and cycling • No change from pre to post campaign in weekly walking minutes • Increase cycling time (+24mins) among cyclists from NESB who live within <1.6kms to trail. • No change in the proportion who accrued ‘sufficient’ amount of walking/cycling.
Lessons from intervention studies • Support causal association, but the effect on population level is small if at all • Over time an increase in usage among those who were aware of trail or had an access. • Inactive groups, minorities, low SES benefited the most – reducing inequality. • Usage can help maintaining level of ‘sufficient activity’ and prevent trend of increased ‘inactivity’. • All interventions required collaboration between sectors
Challenges for future research • Study design: • Costs compromise design (change over time within two cohort and multiple measurements). • which population to sample? all ? proximity? • choosing comparison group (matched on SES) • Better measurement: • unobtrusive new technologies to measure PA • valid common tools for assessing the environment around and in the facility (audit tools)
Challenges for future research • Identifying and evaluate multiple benefits • Other outcomes – not only behavior change social capital, mental health, well being • community empowerment (can not be measured by surveys) • Integrating knowledge from all disciplines • Transport should account for the health context. • Health need to work with communication / marketing experts on promoting the health benefit of trails/ greenways
Challenges for future interventions • Effective collaboration • Frequent communication at all stages • Agreed objectives across all partners • Clear time line • Need assessments, potential health impact (e.g., potential for transport?, exercise venue?) • Best practice for promoting trail/park – how to increase awareness and usage?
Conclusions • There is a great need for well designed evaluation studies to assess the effectiveness of environmental change • Currently, it seemed to have an effect on groups that otherwise would be sedentary • The effects might be seen only at longer term • Multiple outcomes might enhance the importance of environmental changes