Download
1 / 29
350 likes | 642 Views
A Maintenance Program for a bus fleet. Lessons from a Potential CDM Project in India Kaushik Deb, TERI. Structure of the presentation. The policy context CDM and transport: Synergies Key barriers The Project Need for an effective maintenance Inspection Systems: CDM project

E N D
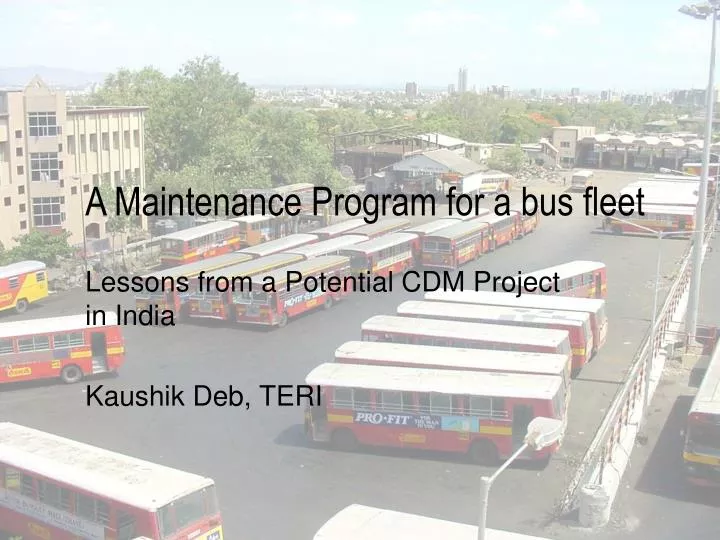
A Maintenance Program for a bus fleet Lessons from a Potential CDM Project in India Kaushik Deb, TERI
Structure of the presentation • The policy context • CDM and transport: Synergies • Key barriers • The Project • Need for an effective maintenance • Inspection Systems: CDM project • Emission savings • Cost estimates • Lessons Transport CDM Workshop
Urban transport in India • Large urban population • Over 1/3 in 2001 • High vehicle density in urban areas • 33% concentrated in cities with 10% population • 82% are personal vehicles • Inadequate public transport • Effective public transport in only 10 cities • Rail in only 3 cities • No urban transport policy • Diffused institutional arrangements • Implications for economic sustainability • Cities are vertices of continued growth
Trends in vehicle population Transport CDM Workshop
Per capita income (US $) Shanghai (2000) $4,000 Vehicle Ownership Vehicles Per 1000 Persons Cities $22,000 356 London (1990) Paris (1990) $34,000 383 Tokyo (1990) 266 $37,000 200 $850 Delhi (1998) 69 Transport CDM Workshop
Urban travel demand projections Sundar & Deb (2000) 7% GDP growth DISHA 2047 Year 2019 5% GDP growth MoST (1999) Transport CDM Workshop
Vehicular Growth Transport CDM Workshop
Policy response in India • Largely technology based response • Vehicle emissions • Fuel quality • Mandating alternative fuels • Inadequate attention to demand management • NMT discriminated against in resource • Land use development haphazard, not in sync with transport planning • Public transport not encouraged, personal vehicles have become more accessible Transport CDM Workshop
New vehicles 1991: First mass emission norms (CO & HC) 1995: Catalytic converters for cars in 4 metros 1996: Further tightening of norms (CO, HC & NOx) 2000: Bharat Stage I (~EUROI) 2001: Bharat Stage II in Delhi (~EURO II) Sustained progress!!! In use vehicles 1989: Idle emission regulation 2004: Some tightening Piece meal efforts Emission norms No Statutory Maintenance & Fuel Efficiency Requirements !!! Transport CDM Workshop
Category Bharat Stage II April 2005 Bharat Stage III April 2010 Bharat Stage IV 2 & 3 wheelers Entire country Entire country (preferably from April 2008) All other new vehicles Entire country Entire country April 2003 7 cities other than metros April 2005 11major cities April 2010 11 major cities Government’s Auto Fuel Policy Transport CDM Workshop
Need for an effective system for in use vehicles • Norms very lax • No consistent improvement • Limited coverage • Only idle tests for CO (petrol) • Free acceleration tests for smoke (diesel) • Limited regulatory ability • Equipment not calibrated • No auditing/ training • Weak maintenance system Transport CDM Workshop
Synergizing Objectives • Global • Significant potential for GHG mitigation in transport in India • National • Positive impacts on local air quality, health & safety • High priority for urban centres • Revenue from carbon credits Transport CDM Workshop
GHG emissions from transport 1999 OECD & IEA 2001 Transport CDM Workshop
Fuel consumption & GHG emissions in Urban India Transport CDM Workshop
Air quality is a concern Transport CDM Workshop
Transport contributes 3-22% of PM emissions Transport CDM Workshop
Financial performance of public transport operators in India Rupees 1800 1600 1400 Costs per 1200 km 1000 800 Revenue per km 600 400 1990 1992 1994 1996 1998 Transport CDM Workshop
Barriers • Baselines • data availability • uncertain sectoral forecasts • Leakages • Fuel efficiency Vs VOCs • Monitoring and verification costs • dispersed and large number of mobile sources • Additionality • Mandated use of alternative fuels • Comprehensive I&C regime proposed Transport CDM Workshop
Project description • Existing maintenance regime inadequate and primitive • Even minor improvements would have large benefits • GHG savings from • Better maintenance • Result: Improved energy efficiency. Hence • GHG savings, Local emissions benefits • Impact: Range estimate of GHG reduction • 5% improvement in fuel efficiency in US (Das et al 2001) • 5.5% improvement in Jakarta (Cornie) • 12.6% improvement in fuel efficiency (USEPA IM240 Program) • 10-20% improvement in fuel efficiency in India (Das et al) Transport CDM Workshop
Project structure • Project proponent: Thane Municipal Transport Undertaking • Statutory public bus company • Owned by Thane Municipal Corporation • Mandate: Provide transport services to Thane • Activities • Bus operation • Depots and terminals • Bus maintenance Transport CDM Workshop
Bus fleet covered in the program Transport CDM Workshop
Visual safety tests Steering Chassis Fuel tank & piping Engine mountings Battery terminals etc Seatbelts Lighting Oil leakages Leaf springs… Automated safety tests Headlamp beam Brakes Sideslip Emissions Volumetric concentration for gasoline Opacity for diesel Maintenance checklist Transport CDM Workshop
Design issues • Project boundary • Government owned bus company. Reduces • institutional complexity • data requirements, thus project development costs • Operational lifetime • Life of equipment = 15 years • Crediting period: 10 years • Reduced uncertainty • Monitoring & verification • Fuel consumption already monitored daily • Hence, no expense on monitoring Transport CDM Workshop
Emission savings: Methodology • GHG emissions • Vehicle kms • Baseline projections based on • Existing travel trends • Expected changes in emission factors, fuel efficiencies • Increasingly stringent norms • Improved technology • Sustained improvements in efficiency:5% • Reference years: 2005 & 2015 Transport CDM Workshop
GHG savings Baseline Reduction scenario Transport CDM Workshop
Project costs • Net present value of project • — US$ 0.13 million • Project cost • US$ 0.54 million • Cost of CO2 • ~ US$ 8.5 • Substantial local benefits Transport CDM Workshop
Transport CDM projects: Lessons • Baselines • Carry out pilot tests to estimate fuel efficiency gains • Leakages • Captive fleet with fixed mobility • Independent of VOCs, exogenously determined demand • Monitoring and verification costs • Data already monitored independently • Preexisting statutory auditing: CAG • Additionality • Comprehensive I&C regime proposed in India • But no maintenance guidelines, requirements Transport CDM Workshop
The Executive Board Baselines Additionality Leakages Monitoring & verification CER market Price of CERs Total CERs Cost of project Cost issues Equity/Debt Vs revenue streams CER revenues only as revenue streams!!! Structure of a CDM project Transport CDM Workshop