Download
1 / 52
540 likes | 661 Views
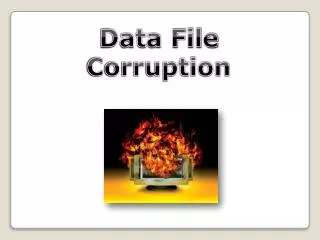
An Analysis of Data Corruption in the Storage Stack. Garth R. Goodson Network Appliance, Inc. Lakshmi N. Bairavasundaram Andrea C. Arpaci-Dusseau Remzi H. Arpaci-Dusseau University of Wisconsin-Madison. Bianca Schroeder University of Toronto. Does Data Corruption Occur?.

E N D
An Analysis of Data Corruption in the Storage Stack Garth R. Goodson Network Appliance, Inc. Lakshmi N. Bairavasundaram Andrea C. Arpaci-Dusseau Remzi H. Arpaci-Dusseau University of Wisconsin-Madison Bianca Schroeder University of Toronto
Does Data Corruption Occur? The corrupt remains of a photo I stored on my laptop
Corruption Anecdote • The thumbnail is still uncorrupted • A few other photos in same directory corrupted • Spatial locality ? • Another file was unreadable • Corrupt metadata or latent sector errors ? • Does corruption correlate with other errors ? • System designers know of similar occurrences • Data protection often based on anecdotes • Anecdotes: interesting and useful, but not enough • A more rigorous understanding is needed
Our Analysis • First large scale study of data corruption • 1.53 million disks in 1000s of NetApp systems • Time period • 41 months (Jan 2004 – Jun 2007) • Corruption detection • Using various data protection techniques • Network Appliance Autosupport Database • Also used in latent sector error [Bairavasundaram07], disk and storage failure [Jiang08] studies
Questions • What kinds of corruption occur and how often ? • Does disk class matter ? • Expensive enterprise (FC) disks versus cheaper nearline (SATA) disks • Does disk drive product matter ? • Are corruption instances independent ? • Do corruption instances have spatial locality?
Talk Outline • Introduction • Background • Data corruption • Protection techniques • Results • Lessons • Conclusion
Data Corruption • Data stored on a disk block is incorrect • Many sources • Software bugs • File system, software RAID, device drivers, etc. • Firmware bugs • Disk drives, shelf controllers, adapters, etc. • Corruption is silent • Not reported by the disk drive • Could have greater impact than other errors
Forms of Data Corruption • Bit corruption • Contents of existing disk block are modified • Data being written to a disk block is corrupted • Lost writes • Disk write not performed but completion is reported • Misdirected writes • Data is written to the wrong disk block • Torn writes • Data only partially written but completion is reported
Client interface (NFS) WAFL® file system Autosupport RAID layer Storage layer Disk drives 1 2 3 NetApp® System • Store, verifyblock identity • (Inode X, offset Y) • Detect identity discrepancy • Lost or misdirected writes • Parity generation • Reconstruction on failure • Data scrubbing • – read blocks, verify parity • – Detect parity inconsistency • – Lost or misdirected writes, • parity miscalculations • Store, verify checksum • Detect checksum mismatch • Bit corruptions, torn writes
Talk Outline • Introduction • Background • Results • Lessons • Conclusion
Overall Numbers What percentage of disks are affected by the different kinds of corruption?
1 2 3 Overall Numbers(% disks affected in 17 months of use) • ~10 times fewer disks than latent sector errors • Higher % of Nearline disks affected • Order of magnitude more than enterprise disks • Bit corruptions or torn writes affect more disks than lost or misdirected writes
Checksum Mismatch (CM) Analysis • Disk class (Nearline / Enterprise) • Disk model • Disk age • Disk size (capacity) • Workload • Factors • Characteristics • Correlations with other errors • Request type • CMs per corrupt disk • Independence • Spatial locality • Temporal locality • Not ready conditions • Latent sector errors • System reset • Scrubs vs. FS reads etc.
Checksum Mismatch (CM) Analysis • Factors • Characteristics • Correlations with other errors • Request type • Disk class • Disk model • Disk age • Disk size • Workload
Factors • Do disk class, model, or age affect development of checksum mismatches? • Disk class: Nearline (SATA) or Enterprise (FC) • Disk model: Specific disk drive product (say Vendor V’s disk product P of capacity 80 GB) • Disk age: Time in the field since ship date • Can we use these factors to determine corruption handling policies or mechanisms? • Ex: Aggressive scrubbing for some disks
Class, Model, Age – Nearline • Fraction of disks affected varies across models • From 0.27% to 3.51% • More than 3% • 4 out of 6 models • Response to age also varies 4.0% 3.5% 3.0% 2.5% 2.0% 1.5% 1.0% 0.5% 0.0% % of disks with at least 1 CM 0 3 6 9 12 15 18 Disk age (months)
Class, Model, Age – Enterprise • Fraction of disks affected varies across models • From 0% to 0.17% • All less than lowest Nearline (0.27%) • Response to age also varies 0.18% 0.16% 0.14% 0.12% 0.10% 0.08% 0.06% 0.04% 0.02% 0.00% % of disks with at least 1 CM 0 3 6 9 12 15 18 Disk age (months)
Factors – Summary • Class, Model matter • Nearline disks require greater attention • Effect of age is unclear • Cannot use age-specific corruption handling
Checksum Mismatch (CM) Analysis • Factors • Characteristics • Correlations with other errors • Request type • CMs per corrupt disk • Independence • Spatial locality • Temporal locality
CMs per Corrupt Disk • Corrupt disk: A disk with at least 1 checksum mismatch (CM) • How many CMs does a corrupt disk have? • Should we “fail-out” disks when one corruption is detected?
CMs per Corrupt Disk – Nearline • CMs per corrupt disk is low • 50% of corrupt disks have ≤ 2 CMs • 90% of corrupt disks have ≤ 100 CMs • Anomaly: E-1 • Develops many CMs 100% 90% 80% 70% 60% 50% 40% 30% 20% 10% 0% % of corrupt disks with ≤ X CMs 1 2 3 4 5 10 20 50 100 200 500 1K Number of CMs
CMs per Corrupt Disk – Enterprise CMs per corrupt disk higher • 50% of corrupt disks have ≤ 10 CMs (2 for Nearline) • 90% of corrupt disks have ≤ 200 CMs (100 for Nearline) 100% 90% 80% 70% 60% 50% 40% 30% 20% 10% 0% % of corrupt disks with ≤ X CMs 1 2 3 4 5 10 20 50 100 200 500 1K Number of CMs
CMs per Corrupt Disk – Summary • Class and model matter • Fewer enterprise disks have CMs, but corrupt disks have more CMs • Fail-out enterprise disks on first CM • Corrupt nearline disks develop fewer CMs • There can be anomalies (Disk model E-1)
Other Characteristics • Very high spatial locality • When multiple CMs occur, they are often for consecutive disk blocks • High temporal locality • Not independent • Over different disks in same system • Defect may be in common hardware components (Example: shelf controller)
Checksum Mismatch (CM) Analysis • Factors • Characteristics • Correlations with other errors • Request type • Scrubs vs. FS reads etc.
Request Type • What types of disk requests detect checksum mismatches? • Is data scrubbing useful?
Request Type • Data scrubbing finds most CMs • Nearline: 49% • Enterprise: 73% • Reconstruction finds CMs • Nearline: 9% • Enterprise: 4% 100% 90% 80% 70% 60% 50% 40% 30% 20% 10% 0% % of CMs discovered Disk Model
Request Type – Summary • Data scrubbing appears to be very useful • Study of scrub rates, workload needed • Mismatches found during reconstruction • Data loss without double disk failure protection [Alvarez97, Blaum94, Corbett04, Park95, Hafner05] • More aggressive scrubbing may be needed
Interesting Behavior Do system designers need to factor in any abnormal behavior?
Block numbers are not created equal! • Typically, each block number has 1 disk where it is corrupt • A series of block numbers are corrupt in many disks • A block-number specific bug? Disk Model: E-1 120 100 80 60 40 20 0 Number of disks with CM at block X Block Number Space
Talk Outline • Introduction • Background • Results • Lessons • Conclusion
Lessons • Data corruption does occur • Even rare errors like lost writes do occur • Corruption handling mechanisms are essential • Very few enterprise disks develop corruption • “Fail-out” these disks on first corruption detection • High spatial locality • Spread out redundant data within the same disk
Lessons (contd.) • Temporal locality, consecutive blocks affected • May be corruption occurs during the same write op • Write redundant data with separate disk requests, spaced out over time • Corruption could be block number specific 0 N
Lessons (contd.) • Temporal locality, consecutive blocks affected • May be corruption occurs during the same write op • Write redundant data with separate disk requests, spaced out over time • Corruption could be block number specific • “Staggered” RAID stripes could be used 0 N
Conclusion • Our analysis • First large scale study of data corruption • Corruptions detected by NetApp production systems • Data corruptions do occur • Affect ~10 times fewer disks than latent sector errors • Nearline (SATA) disks are most affected • Corruption handling mechanisms are essential • Data corruption characteristics • Depend on disk class and disk model • Not independent (both within disk and within system) • High spatial and temporal locality • May occur at specific block numbers
Thank You! Advanced Systems Lab (ADSL) University of Wisconsin-Madison http://www.cs.wisc.edu/adsl Advanced Technology Group (ATG) Network Appliance, Inc. http://www.netapp.com/company/research/ Department of Computer Science University of Toronto http://www.cs.toronto.edu/~bianca
Temporal Locality • Isn’t temporal locality tied to when the mismatch is detected ? • Yes. It may be due to scrubbing • We also looked at mismatches detected more than 2 weeks apart • We found strong autocorrelation across mismatches up to 10 months apart • Indicates temporal locality fairly independent of detection time
Non-independence within systems • We found a system with 92 corrupt disks • Fraction of systems = 1*10-5 (about 100,000 systems in the study) • Probability of such an occurrence = 1*10-12 (based on fraction of disks that develop CMs)
Comparison: Latent Sector Errors In addition: Both errors are not independent, have very high temporal locality, are often detected by scrubbing, and have correlations with each other
Spatial Locality • Use locality radius to measure locality Logical Block Number Space End of disk Beginning of disk (Block no. 0) • 100 Block locality radius • 1000 Block locality radius 100 block: 2/5 errors have 1 neighbor 1000 block: 4/5 errors have 1 neighbor
References • [Alvarez97] G. A. Alvarez, W. A. Burkhard, and F. Christian, "Tolerating multiple failures in RAID architectures with optimal storage and uniform declustering" Proceedings of the 24th Annual International Symposium on Computer Architecture pgs. 62-72, 1997 • [Blaum94] M. Blaum, J. Brady, J. Bruck, and J. Menon. "EVENODD: An efficient scheme for tolerating double disk failures in RAID architectures". In Proc. of the Annual International Symposium on Computer Architecture, pgs. 245-254, 1994 • [Corbett04] P. Corbett, B. English, A. Goel, T. Grcanac, S. Kleiman, J. Leong, and S. Sankar. “Row-diagonal parity for double disk failure”. In Proceedings of the Third USENIX Conference on File and Storage Technologies, pages 1-14, 2004 • [Hafner05a] J. L. Hafner, V. Deenadhayalan, KK Rao, and J. A. Tomlin. “Matrix methods for lost data reconstruction in erasure codes”. In Proceedings of the Fourth USENIX Conference on File and Storage Technologies, San Francisco, CA USA, December 2005. • [Hafner05b] J. L. Hafner. “WEAVER Codes: Highly Fault Tolerant Erasure Codes for Storage Systems”. In Proceedings of the Fourth USENIX Conference on File and Storage Technologies, San Francisco, CA USA, December 2005. • [Park95] C. I. Park, "Efficient placement of parity and data to tolerate two disk failures in disk array systems". IEEE Transactions on Parallel and Distributed Systems, Nov. 1995
Terminology • Disk class • Nearline: ATA interface, secondary storage • Enterprise: Fibre-Channel interface, primary storage • Enterprise disks are higher performance, better built, more flexible disks • Disk family • A particular disk product • E.g. Quantum Fireball EX • Denoted as ‘A’ to ‘E’ (nearline), ‘f’ to ‘o’ (enterprise)
Terminology (contd.) • Disk model • Combination of disk family and particular size • E.g. Quantum Fireball EX – 6.4 GB • Denoted as ‘E-1’, ‘E-2’ etc. • Disk age • Amount of time in the field since ship date • Corrupt disk • A disk with at least one checksum mismatch
Types of Data Corruption • Checksum Mismatch (CM) • The data does not match the checksum • Causes: Data bit corruption, torn writes • Parity Inconsistency (PI) • The parity does not match the data blocks • Causes: Lost writes, misdirected writes, incorrect parity calculation • Identity Discrepancy (ID) • The disk block identity does not match the expected identity on file read • Causes: Lost writes, misdirected writes
Overall Numbers(% disks affected in 17 months of use) • Checksum mismatches • Nearline: 0.66%, Enterprise: 0.06% • Parity inconsistencies • Nearline: 0.147%, Enterprise: 0.017% • Identity discrepancies • Nearline: 0.042%, Enterprise: 0.006% • Higher % of Nearline disks affected • Order of magnitude more than enterprise disks • Bit corruptions or torn writes are important • Affect more disks than lost or misdirected writes
Important Results • Data corruption does occur • Affects ~10 times fewer disks than latent sector errors • Class matters: Expensive is better • More Nearline (SATA) disks affected (0.66%) • Fewer Enterprise (FC) disks affected (0.06%) • Model matters • Different disk models show different behavior • Corruption instances are not independent • Instances show high spatial, temporal locality • Number of corruptions low in general