Download
1 / 15
150 likes | 276 Views
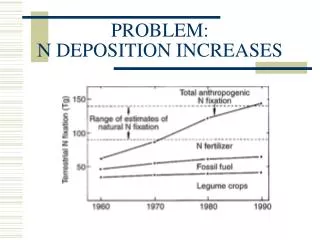
N Deposition in the Netherlands. Implications for Natura 2000. Jan Bakker. September 2009. Content:. N-emission and -deposition Impact on Dutch Natura 2000 areas Suggestions for a strategy. Nitrogen emission: trends. NOx. NH 3. Sources of N-emission. NOx: 62 % traffic/ transport

E N D
N Deposition in the Netherlands Implications for Natura 2000 Jan Bakker September 2009
Content: • N-emission and -deposition • Impact on Dutch Natura 2000 areas • Suggestions for a strategy
Nitrogen emission: trends NOx NH3
Sources of N-emission NOx: 62 % traffic/ transport 26 % industry / energy 3 % agriculture NH3: 2 % traffic/ transport 5 % industry/ energy 91 % agriculture
N-deposition Average ‘free aerial’ fertilizing: 25-30 kg total N/ha/yr
Sources of N-deposition 30% from livestock housing 32% from foreign countries 51% from Dutch agriculture Use of livestock Manure 14 %
Geographical origin of N-deposition on Natura 2000-areas (average) • 5-15 % of the deposition from sources within 1000 meter: increasing with emission density • 50-75 % of the deposition from sources inside 15x15 km: increasing with emission density • The remainder from sources outside 15x15 km; relative part decreasing with emission density, but absolute contibution remains constant
Impact Nature 2000:Soil map • Yellow: • Sandy and oligotrophic soils • Vulnerable for eutrophication • Within yellow: • Concentration areas for • intensive animal husbandry
Problems! • Average annual deposition in east/south Netherlands is 1500-2000 mol N/ha • That is 2-4 times as much as the critical loads of most vulnerable types • Ca 50 % of Dutch habitattypes is ‘overloaded’ or at least at risk as a result of N-deposition (NB: NOT 50 % of the surface!!)
So this is the present situation: • Environmental stress on many habitat types • Many N2000 conservation objectives under pressure As a result of EU/ national legislation: • Legal authorization for future extensions of farms (cowsheds, pig stocks) will not be granted because of significant impacts • Social impasse and polarization
What to do? Outline of a combined strategy • Track 1: Reducing local emission bottlenecks (outplacement of farms from the edge of vulnerable Natura 2000 areas); AND • Track 2: Reducing background deposition (action at (inter-)national level); AND • Track 3: Improving other environmental conditions: site management, hydrological conditions, fragmentation…