USING DATA FOR SCHOOL IMPROVEMENT
USING DATA FOR SCHOOL IMPROVEMENT. Charting the Course. Phase II - Analyzing the System. Step 1. Form the District Leadership Team. Step 2. Collect and Organize Additional Data. Step 3. Conduct a Gap Analysis. Step 4. Formulate a Problem Statement. Step 5. Describe the Ideal State.

USING DATA FOR SCHOOL IMPROVEMENT
E N D
Presentation Transcript
USING DATA FOR SCHOOL IMPROVEMENT Charting the Course
Phase II - Analyzing the System • Step 1. Form the District Leadership Team. • Step 2. Collect and Organize Additional Data. • Step 3. Conduct a Gap Analysis. • Step 4. Formulate a Problem Statement. • Step 5. Describe the Ideal State.
Data Analogy • Think about the data collected on a school district or campus. • With a partner, discuss how this data and its analysis are analogous to the “focus” and “zoom” functions on a camera.
Data Scenario 1-A Ranking by H. S. Graduation Rate (Class of 2002) 1) New Jersey 2) Iowa 3) Wisconsin 4) North Dakota 5) Minnesota 6) Nebraska 7) Pennsylvania 8) Connecticut What general conclusion can we reach regarding these 8 states?
Data Scenario 1-B • You have been given a list [Greene & Winters (2005)] with states’ cumulative graduation rates from the class of 2002. Fill in the blanks with the following states’ ranks. • Colorado ____ Michigan ____ • Iowa ____ Nebraska ____ • Massachusetts ____ North Dakota ____ • Minnesota ____ Pennsylvania ____
Data Scenario 1-B • What do those 8 states have in common? • Answer: http://mb2.ecs.org/reports/Report.aspx?id=735 (Education Commission of the States database)
Data Scenario 1-B Ranking by H. S. Graduation Rate (Class of 2002) 1) New Jersey ** 2) Iowa 3) Wisconsin ** 4) North Dakota ** 5) Minnesota ** 6) Nebraska ** 7) Pennsylvania 8) Connecticut ** Denotes that there are no state mandated course requirements for graduation.
Data Scenario 1-C Ranking by H. S. Graduation Rate (Class of 2002) 1) New Jersey ** ^ 2) Iowa ^ 3) Wisconsin ** ^ 4) North Dakota ** 5) Minnesota ** ^ 6) Nebraska ** ^ 7) Pennsylvania ^ 8) Connecticut ** Denotes that there are no state mandated course requirements for graduation ^ Denotes that this state has no exit exam requirement for graduation
Data Scenario 1-D Having this additional information, revisit the state rankings and discuss with others at your table how that knowledge might impact your interpretation of the original state ranking data.
Data Scenario 2 • Review the “Gummy Bears” scenario. • Based on the given data, what is this student’s level of understanding of the concept of multiplication? Discuss with others at your table and be prepared to share with the entire group.
What Data? • As a table group, use one index card and the guiding questions below. List the types of data needed to guide school improvement efforts. Select a spokesperson to share out. • What data and strategies are necessary for finding out whether the steps that districts or campuses are taking are making a difference for all students? • What data will help you know what needs to change in order to get better results?
What Data? • One measure, by itself, gives useful information. • Comprehensive measures used together and over time provide much richer information. • Together, these measures can provide a powerful picture that can help us understand the school’s impact on student achievement. • These measures, when used together, give schools the information they need to get the results they want.
Bernhardt’sModel of Data Categories Demographics School Processes Perceptions Student Learning Bernhardt, V. (2004). Data analysis for continuous school improvement (2nd ed.). Larchmont, NY: Eye on Education.
Dr. Victoria L. Bernhardt • Will be at Learning for a “Change” Summit III, sponsored by Region 16 Title I Statewide School Support/Parental Involvement Initiative • September 30, 2008 8:30 am – 3:30 pm • ESC 16 Workshop Registration Deadline: September 15, 2008 • http://www.esc16.net/dept/isserv/title1swi/parental/workshop%20info08_09.html
Examples: Enrollment Attendance Drop-out Rate Ethnicity Gender Grade Level Language Proficiency Demographics School Processes Perceptions Student Learning Bernhardt’s Model of Data Categories
Examples: Perceptions of learning environment Values and beliefs Attitudes Observations Demographics School Processes Perceptions Student Learning Bernhardt’s Model of Data Categories
Demographics Examples: TAKS Norm-referenced tests Teacher observations Authentic assessments SchoolProcesses Perceptions Student Learning Bernhardt’s Model of Data Categories
Example: Description of school programs and processes Demographics School Processes Perceptions StudentLearning Bernhardt’s Model of Data Categories
Time Although not a data category, time is an important variable that needs to be an integral component with the four data types. Looking at data over time adds a dimension that usually reveals data trends and increases overall understanding of the collected information.
Data Categories in Real Context • You have been provided with an abbreviated AEIS report from ABC Junior High School. Individually, scan through the data with a focus on the types of data categories found and the types of conclusions that can be reached with that data. • Discuss the above with your table group. Also, be mindful of what things these data do not tell you. • Be prepared to share with the whole group.
Intersecting Categories of Data • By itself, each category of data provides a limited perspective. • A much clearer picture and deeper understanding are developed by merging data from different sources and from different categories.
Demographics Demographic/ Student Learning Data Tells us: whether specific groups of students are learning at the same level or not Student Learning Bernhardt’s Model of Data Categories
Bernhardt’s Model of Data Categories School Processes Perceptions School Process/Perceptions Data Tell us: if student perceptions about a school program are favorable Adapted from: Bernhardt, V. (2004). Data analysis for continuous school improvement (2nd ed.). Larchmont, NY: Eye on Education.
Working with Data Categories Each table has been provided with sets of 4 circles each. The circles represent Bernhardt’s 4 data categories. With a partner, choose any two of the circles and place them in such a way that they illustrate an intersection of the two data types. Make up a real life educational context of data that would represent that intersection. Be prepared to share with the whole group.
Working with Data Categories Data Scenario 1: Are students who are most satisfied with school (group A) being taught differently from students who are not satisfied with school (group B), and who are these students? Discuss at your tables: What data categories are needed? What could be some examples that model the question and data scenario above?
Demographics (which students) School Processes Perceptions (how taught) (satisfaction) Bernhardt’s Model of Data Categories
Working with Data Categories Data Scenario 1: Data that is the intersection of school processes, perceptions, and demographics … Based on your discussion, how could this type of information inform your district or campus improvement plan? Discuss this with a partner at your table.
Working with Data Categories Data scenario 2: What are the differences in student learning results, based on who the students are and how they are taught algebra? Discuss at your tables: What data categories are needed? What could be some examples that model the question and data scenario above?
Demographics (which students) School Processes (how taught) Student Learning (algebra achievement) Bernhardt’s Model of Data Categories
Working with Data Categories • Data Scenario 2 : • Data that is the intersection of school processes, student learning, and demographics … • Again, based on your discussion, how could this type of information inform your district or campus improvement plan? Discuss this with a partner at your table.
Revisit Data Category List • Find your index card and review the data category list that you developed earlier. • Discuss with others at your table any additional types and/or combinations of data that you utilize in your work and how useful/informative those data are. • Be prepared to share with the whole group.
Beyond Raw Data • Raw data alone, even from different sources and from different categories is insufficient. • How that data is organized, analyzed, and presented is critical.
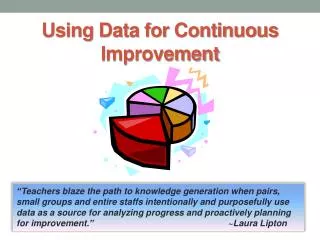
Presenting Data • It is critically important to graph the data in such a way that everyone on staff can understand the information in the same way. Graphs allow us to see the same information at the same time. • It is important to make the graph as clear as possible for no misinterpretations. It is crucial to label the graphs and to pay attention to the scale and baselines of the graphs.
Data Organization Student Achievement
Data Organization Parent Involvement
School Support Teams and Data At your table group, discuss the following: • 1) How might the SST encourage districts and schools to collect data? • 2) How might the SST help districts and schools analyze and use data?
Using Data to Analyze the System Tools and processes used in the Working Systemically approach
SEDL — Working Systemically • As part of a long-term collaboration with the Dana Center and districts in several states, SEDL developed processes and tools for data collection and organization. • Refer to the handout Alignment Summary of District and Campus Data SEDL. (2005). Working systemically to increase student achievement in reading and mathematics. Austin, TX: Author.
Perception Data from Surveys,Conversations, and Focus Groups
SEDL Data Collection Tools Working Systemically Survey: • TXCC offers this survey tool on-line. Campuses may choose a the mathematics or reading surveys depending on their AYP data and needs. (Revised survey will be generic for content area.) • TXCC will assist by providing data graphs and report. Contact your TXCC support staff, who will send the report(s) to you. NOTE: The survey Web site is currently being revised.
Working Systemically Survey Go to http://txcc.sedl.org/survey/ws/ And follow the prompts. To go to a specific survey, you may use these links: Mathematics • http://survey.sedl.47.dll/s/1g6 Reading • http://survey.sedl.org/efm/wsb.dll/s/1g7
Conversations With Leaders • Ten questions are provided for district and school leader conversations. • Information can be added to the Alignment Summary.