Download
1 / 12
120 likes | 446 Views
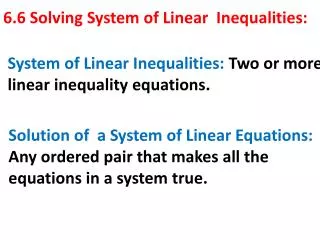
6.6 Linear Inequalities. TSWBAT sketch the region defined by linear inequality. Chapter 6 Algebra 1 Ms. Mayer. Overview. Graphing Linear Inequalities s olid line or dotted line which s ide to shade Writing Inequalities from a graph. Graphing Linear Inequalities in Two Variables.

E N D
6.6 Linear Inequalities TSWBAT sketch the region defined by linear inequality Chapter 6 Algebra 1 Ms. Mayer
Overview • Graphing Linear Inequalities • solid line or dotted line • which side to shade • Writing Inequalities from a graph
Graphing Linear Inequalities in Two Variables How would you graph the equation x + y = 3? x + y = 3 -x -x y = -x + 3 m = -1 b = 3 What happens if the “=“ changes to “≤” or “≥”? We get shading!!!
Solid or dashed? The lines can be graphed as a solid line or a dashed (dotted) line. When do you think it’s solid, and when is it dashed? Think about graphing points on a number line; when is it open and when is it closed? < or > is … ≤ or ≥ is …
Graphing linear inequalities with two variables Middle row:
Graphing linear inequalities with two variables Bottom row:
Graphing Linear Inequalities Steps: 1. Graph the equation (solve for y) 2. Draw a Dotted or Solid line 3. Pick a point not on a line (any point) 4. Shade the correct side • True – shade the same side • False – shade the opposite side
Writing an Inequality Write an inequality for each graph. 5. 6.
Writing an Inequality Write an inequality for each graph. 7. 8.
Homework Graphing Inequalities • Solid line/Dotted line • Shading • HW: • 6.6 worksheet