1 / 0

An Overview of the Types of Performance Data Used to Describe Missouri Schools

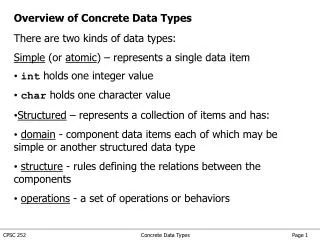
An Overview of the Types of Performance Data Used to Describe Missouri Schools. Sharon Ford Schattgen, Ph.D. November 7, 2012 Presentation Prepared for the Missouri Charter School Association ’ s Seminar for Governing Board Members.

kalin
Download Presentation

An Overview of the Types of Performance Data Used to Describe Missouri Schools

An Image/Link below is provided (as is) to download presentation Download Policy: Content on the Website is provided to you AS IS for your information and personal use and may not be sold / licensed / shared on other websites without getting consent from its author. Content is provided to you AS IS for your information and personal use only. Download presentation by click this link. While downloading, if for some reason you are not able to download a presentation, the publisher may have deleted the file from their server. During download, if you can't get a presentation, the file might be deleted by the publisher.

E N D

Presentation Transcript


  1. An Overview of the Types of Performance Data Used to Describe Missouri Schools

    Sharon Ford Schattgen, Ph.D. November 7, 2012 Presentation Prepared for the Missouri Charter School Association’s Seminar for Governing Board Members A Close Look at the Indices that Governing Board Members Should Use to Evaluate Charter School Quality
  2. Types of Performance Data Used to Evaluate School Quality Missouri Assessment Program Data MAP Grade-Level Assessment & End-of-Course Assessment Proficiency Rates TerraNova Median National Percentile Ranks MAP Scale Scores Averages, Arrayed by Cohort MAP Index Scores MAP Growth Estimates Other Summative Standardized Assessment Data Additional Standardized Achievement Test Scores (e.g., Stanford, ITBS, etc.) College Readiness/Placement Data (e.g., ACT/SAT Scores, Advanced Placement Scores) Local Interim Assessment Data (e.g., NWEA Assessment Data) Additional Performance Measures Attendance, Dropout, & Graduation Rates Post-Secondary Success Data Accountability Data Missouri School Improvement Program Annual Performance Report (MSIP APR) Information Associated with Special Designations
  3. School X Demographic Data Free/Reduced Price Lunch Percentages for Corresponding Years: Comparison District = 72.3%, 68.7%, 83.8%, 85.7%, 87.4%; MO = 42.1%, 43.7%, 46.9%, 47.8%, 49.5%
  4. Note 1: Disaggregation of data by “subgroup” is required! One of the goals of the No Child Left Behind Act is to eliminate discrepancies in achievement across “subgroups” of students, which means Governing Board members should examine data that are disaggregated to allow you to see any “gaps” in performance. In other words, you need to review data that are disaggregated by racial or ethnic group, free/reduced-price lunch status, special-education status, and limited English proficiency status, and, when appropriate, gender.
  5. Note 2: Most of the data Governing Board members will receive will not be presented in its original format. Rather, it will likely be summarized and reformatted for the purposes of creating an annual report. School personnel access their data from the DESE MCDS Portal, and test publishers also provide electronic and print reports. School Report Cards are posted at www.dese.mo.gov
  6. Note 3: We assess achievement for specific purposes; here are 5 such purposes. Provide summary information about what students know and can do relative to course objectives or content/process standards Yield information on an interim basis to inform policymaker and/or educator decisions at classroom, school, or district level Collect student-centered information to guide minute-by-minute and/or day-to-day instruction Place students in specific programs/services Identify students who need further evaluation Purposes 3, 4, and 5 (listed in green, italic type) yield data that are not appropriate for inclusion in a report to a Governing Board. Data collected for these purposes have utility only for educators.
  7. Tiers of Achievement Assessment Perie, Marion, & Gong, 2009 Summative Scope (curriculum focus) & duration of cycle (time frame) Increasing Interim (instructional, evaluative, predictive) aka “common” or “benchmark” Formative (minute by minute and/or day-to-day integrated into lesson) aka “classroom” Frequency of administration
  8. A Reminder: Types of Performance Data Used to Evaluate School Quality Missouri Assessment Program Data MAP Grade-Level Assessment & End-of-Course Assessment Proficiency Rates TerraNova Median National Percentile Ranks MAP Scale Scores Averages, Arrayed by Cohort MAP Index Scores MAP Growth Estimates Other Summative Standardized Assessment Data Additional Standardized Achievement Test Scores (e.g., Stanford, ITBS, etc.) College Readiness/Placement Data (e.g., ACT/SAT Scores, Advanced Placement Scores) Local Interim Assessment Data (e.g., NWEA Assessment Data) Additional Performance Measures Attendance, Dropout, & Graduation Rates Post-Secondary Success Data Accountability Data Missouri School Improvement Program Annual Performance Report (MSIP APR) Information Associated with Special Designations
  9. Missouri Assessment Program (MAP) Grade-Level & End-of-Course (EOC) Assessment Proficiency Rates “MAP Proficiency Rate” is the percentage of students scoring in the top two MAP achievement levels—the Proficient Level and the Advanced Level. Following a brief introduction to the MAP, there is a sample line graph showing trends in MAP Grade-Level Proficiency Rates, a sample bar graph showing disaggregated Grade-Level Proficiency Rates for one year, and a sample table showing trends in End-of-Course Proficiency Rates. Assessment Data
  10. Missouri Assessment Program (MAP) MAP includes required consecutive grade-level (3-8) assessments in Communication Arts and Mathematics and grade-span (5 and 8) assessments in Science. MAP also includes end-of-course (EOC) exams, including English II, Algebra I, and Biology I. See DESE website for testing requirements. MAP results are analyzed and reported in a variety of ways in order to inform policy and practice and to satisfy federal and state accountability requirements. Performance on each MAP assessment is reported in terms of four achievement levels: Below Basic, Basic, Proficient, and Advanced. The TerraNova tests, which yield National Percentile Ranks, are components of the MAP grade-level assessments. MAP results are also reported using Scale Scores (calculated by test publisher). DESE also calculates MAP Index Scores to use in the MO School Improvement Program (state accountability system).
  11. MAP Mathematics Proficiency RatesGrade 7
  12. MAP End-of-Course (EOC) ExamProficiency Rates
  13. TerraNova Median National Percentile Ranks TerraNova Tests are embedded within the MAP Grade-Level Assessments. Each TerraNova yields a National Percentile Rank, which allows us to compare the performance of our students to that of their national grade-level peers. To report group performance, we calculate the Median National Percentile Rank. TerraNova Median National Percentile Ranks for multiple years are shown on the following slide. Assessment Data
  14. TerraNova Median National Percentile Ranks School X Communication Arts School X Mathematics School X Science (Grade 8) 2008: 39 2009: 30 2010: 37 2011: 36 2012: 37 NATIONAL Terra Nova Median Percentile Rank = 50; Range = 1 to 99
  15. MAP Scale Score Averages, Arrayed by Cohort When arrayed by cohort, MAP Scale Score Averages show the change over time for a given group of students as they move through the grade span (e.g., sixth grade to seventh grade; seventh grade to eighth grade). This type of analysis, shown in the following table, indicates, in a very general way, whether there is student growth in achievement. Assessment Data
  16. MAP Scale Score Averages for Grade CohortsSchool X Communication Arts MAP Communication Arts Scale Scores range from 455 to 875 (grades 3-8).
  17. MAP Index Scores Each year, DESE calculates a MAP Index Score for each content area in each grade span. The Index is calculated by multiplying the percentage of reportable students scoring within a given achievement level by a constant: 6 x % in Below Basic; 7 x % in Basic; 8 x % in Proficient; and 9 x % in Advanced. The resultant products are then summed to produce the Index, which ranges from 600-900. MAP Index Scores, arrayed over time, are used in the Missouri School Improvement Program as an indicator of whether there is longitudinal improvement in performance. The following table presents an example of MAP Index Scores over time. Assessment Data
  18. School YMAP Index Scores Source: Understanding Your Annual Performance Report, 2012-13. Missouri Department of Elementary & Secondary Education
  19. MAP Growth Estimates MAP Growth Estimates are calculated using complex statistical formulae, which utilize each student’s MAP Scale Scores over time—for example, from sixth grade to seventh grade, and from seventh grade to eighth grade. The Department of Elementary and Secondary Education first reported MAP growth data in 2011 The next slide presents an example of MAP growth data. Assessment Data
  20. MAP Value-Added Growth EstimatesMathematics 2011 2012 State Range: -3 to +3 State Average = 0 *Growth estimates were calculated using longitudinal MAP grade-level assessment data.
  21. Other Summative Standardized Assessment Data Students may take other summative standardized assessments, in addition to the MAP—assessments such as the Stanford Achievement Test or the Iowa Test of Basic Skills or ACT’s EXPLORE or PLAN. If so, these tests will likely be administered in the fall or the spring of the year. Results are used to inform instructional decisions. A subsequent slide presents an example of data from PLAN, a standardized test that may be administered to 10th-grade students. Assessment Data
  22. Data from Other Standardized Achievement Tests In addition to the MAP, students may take another summative assessment, such as Stanford Achievement Test, Iowa Test of Basic Skills, EXPLORE, or PLAN. Scores from these tests could be reported in terms of: Median Percentile Rank Percent of Students Scoring At or Above Grade Scale Score Average
  23. In 2008-09, 67% of CPS students earned Composite Scores at or above the national average.
  24. College Readiness/Placement Data The ACT is a set of curriculum-referenced tests that measure students’ readiness for college. ACT Scale Scores range from 1 to 36, and the 2012 national average is 21.1. A student whose Scale Score in a particular content area meets or exceeds the corresponding ACT College Readiness Benchmark has a high probability of being successful in an entry-level, credit-bearing college course in that subject. Scores from Advanced Placement Exams are used to award college credit or advanced placement in college coursework. Advanced Placement Exam cores range from 1 to 5. The following tables present example ACT data and Advanced Placement data. Assessment Data
  25. ACT Scale Score AveragesClass of 2012
  26. ACT Data: Class of 2012 Percentage of 2012 graduates taking ACT: School X = 85% Comparison District = 70% MO = 67-75% US = 52%
  27. NWEA Assessment Indices Some charter schools periodically administer classroom-based assessments (such as those published by NWEA, the Northwest Evaluation Association) in order to monitor student progress and to adjust instruction based on student needs. Pre- and post-test NWEA assessment indices for the 2011-12 school year are presented on the following table; however, these data must be interpreted with care because we have no evidence of their technical characteristics (e.g., reliability and validity). However, such data could be appropriate for inclusion in a report to a board because they have the potential to provide information about student learning. Assessment Data
  28. Example of Local Interim Assessment: NWEA Indices
  29. Attendance, Dropout, & Graduation Rates; Post-Secondary Success Data Attendance rates, dropout rates, and graduation rates, along with data about post-secondary success, are shown on the following four slides. These measures of performance complement achievement data. Additional Performance Measures
  30. Attendance Rate
  31. Dropout Rate
  32. Graduation Rate Graduation Rate Provide trend data when possible.
  33. Graduation Rate Post-Secondary Placement Rate Over 85% of School Y’s 2010 graduates enrolled in post-secondary institutions, entered the job market in a field related to their career-education coursework, or joined the military.
  34. Missouri School Improvement Program: Annual Performance Report The MSIP APR presents evaluative data about districts and charter schools in relation to 14 accountability standards. Schools are held accountable for only those standards pertaining to its grade span. In accordance with established criteria, the Missouri Department of Elementary & Secondary Education can issue designations based on a school’s or a district’s performance. The following two tables summarize School X’s and a comparison district’s 2012 MSIP APRs and provide data supporting a specific designation—in this case as a “focus school.” Accountability Data
  35. 2012 MSIP Annual Performance Report
  36. School X “Focus School” Indices Combined English/Language Arts & Mathematics Proficiency Rate = 26.2% Targets: Communication Arts = 44.21%; Math = 44.78%
  37. And, by the way . . . The tests, they are a changin’ In 2014-15, new state assessments will become operational in Missouri—assessments that are referenced to the Common Core State Standards and are designed to measure students’ readiness for college and careers. Two consortia are developing such assessments: * Smarter Balanced * PARCC
  38. In closing . . . . Questions & Comments . . . . For further information, go to these websites. MAP Assessments & MSIP: www.dese.mo.gov Assessment Consortia: www.smarterbalanced.org www.parcconline.org
More Related