Differentiation
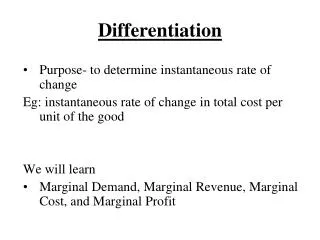
Differentiation. Purpose- to determine instantaneous rate of change Eg: instantaneous rate of change in total cost per unit of the good We will learn Marginal Demand, Marginal Revenue, Marginal Cost, and Marginal Profit. Marginal Cost : MC(q). What is Marginal cost?

Differentiation
E N D
Presentation Transcript
Differentiation • Purpose- to determine instantaneous rate of change Eg: instantaneous rate of change in total cost per unit of the good We will learn • Marginal Demand, Marginal Revenue, Marginal Cost, and Marginal Profit
Marginal Cost :MC(q) • What is Marginal cost? The cost per unit at a given level of production EX: Recall Dinner problem C(q) = C0 + VC(q). = 9000+177*q0.633 MC(q)- the marginal cost at q dinners MC(100)- gives us the marginal cost at 100 dinners This means the cost per unit at 100 dinners How to find MC(q) ? We will learn 3 plans
Marginal Analysis • First Plan • Cost of one more unit
Marginal Analysis • Ex. Suppose the cost for producing a particular item is given by where q is quantity in whole units. Approximate MC(500).
Marginal Analysis • Second Plan • Average cost of one more and one less unit
Marginal Analysis • Ex. Suppose the cost for producing a particular item is given by where q is quantity in whole units. Approximate MC(500).
Marginal Analysis • Final Plan • Average cost of fractionally more and fractionally less units difference quotients • Typically use with h = 0.001
Marginal Analysis • Ex. Suppose the cost for producing a particular item is given by where q is quantity in whole units. Approximate MC(500). In terms of money, the marginal cost at the production level of 500, $6.71 per unit
Marginal Analysis • Use “Final Plan” to determine answers • All marginal functions defined similarly
Marginal Analysis • Graphs D(q) is always decreasing All the difference quotients for marginal demand are negative MD(q) is always negative
Marginal revenue 0 Marginal Analysis Maximum revenue • Graphs q1 q1 • R(q) is increasing • difference quotients for marginal revenue are positive • MR(q) is positive • R(q) is decreasing • difference quotients for marginal revenue are negative • MR(q) is negative
Marginal Analysis • Graphs
Derivatives-part 2 • Difference quotients • Called the derivative of f(x)
Derivatives • Ex1. Evaluate if
Derivatives • Differentiating.xls file • Graphs both function and derivative • Can evaluate function and derivative
Derivatives • Differentiating.xls
Derivatives • Use Differentiating.xls to graph the derivative of on the interval [-2, 8]. Then evaluate .
Differentiating.xslm • Key points • Formula for the function in x • Plot Interval is ESSENTIAL • You can use the computation cells to evaluate the f(x) & f’(x) at different values • If using Office 2007, save it as a macro enabled file
Derivatives • Properties If (c is a constant) then If (m is a constant) then If then If then
Derivatives • Tangent line approximations • Useful for easy approximations to complicated functions • Need a point and a slope (a derivative) • Use y = mx +b
Derivatives • Ex. Determine the equation of the tangent line to at x = 3. • Recall and we have the point (3, 14) • Tangent line is y = 5.5452x – 2.6356
Derivatives • Project (Marginal Revenue) - Typically - In project, - units are
Recall:Revenue function-R(q) • Revenue in million dollars R(q) • Why do this conversion? Marginal Revenue in dollars per drive
Derivatives • Project (Marginal Cost) - Typically - In project, - units are
Derivatives • Project (Marginal Cost) - Marginal Cost is given in original data - Cost per unit at different production levels - Use IF function in Excel
Derivatives • Project (Marginal Profit) MP(q) = MR(q) – MC(q) - If MP(q) > 0, profit is increasing - If MR(q) > MC(q), profit is increasing - If MP(q) < 0, profit is decreasing - If MR(q) < MC(q), profit is decreasing
Derivatives • Project (Marginal Cost) - Calculate MC(q) Nested If function, the if function using values for Q1-4 & 6 - IF(q<=800,160,IF(q<=1200,128,72)) In the GOLDEN sheet need to use cell referencing for IF function because we will make copies of it, and do other project questions =IF(B30<$E$20,$D$20,IF(B30<$E$22,$D$21,$D$22))
Recall -Production cost estimates • Fixed overhead cost - $ 135,000,000 • Variable cost (Used for the MC(q) function) • First 800,000 - $ 160 per drive • Next 400,000- $ 128 per drive • All drives after the first 1,200,000- $ 72 per drive
Derivatives • Project (Maximum Profit) - Maximum profit occurs when MP(q) = 0 - Max profit occurs when MR(q) = MC(q) - Estimate quantity from graph of Profit - Estimate quantity from graph of Marginal Profit
Derivatives-change • Project (Answering Questions 1-3) 1. What price? $285.88 2. What quantity? 1262(K’s) units 3. What profit? $42.17 million
Derivatives • Project (What to do) - Create one graph showing MR and MC - Create one graph showing MP - Prepare computational cells answering your team’s questions 1- 3
Marginal Analysis- • where h = 0.000001 • MR(q) = R′(q)∙1,000 Marketing Project
Marginal Analysis- • where h = 0.000001 • In Excel we use derivative of R(q) • R(q)=aq^3+bq^2+cq • R’(q)=(a*3*q^2+b*2*q+c)/1000 Marketing Project
Marginal Analysis (continued)- Marketing Project
Marginal Analysis • MP(q) = MR(q) – MC(q) • We will use Solver to find the exact value of q for which MP(q) = 0. Here we estimate from the graph Marketing Project
Profit Function • The profit function, P(q), gives the relationship between the profit and quantity produced and sold. • P(q) = R(q) – C(q)
Goals 1. What price should Card Tech put on the drives, in order to achieve the maximum profit? 2. How many drives might they expect to sell at the optimal price? 3. What maximum profit can be expected from sales of the 12-GB? 4. How sensitive is profit to changes from the optimal quantity of drives, as found in Question 2? 5. What is the consumer surplus if profit is maximized? 38
Goals-Contd. 6. What profit could Card Tech expect, if they price the drives at $299.99? 7. How much should Card Tech pay for an advertising campaign that would increase demand for the 12-GB drives by 10% at all price levels? 8. How would the 10% increase in demand effect the optimal price of the drives? 9. Would it be wise for Card Tech to put $15,000,000 into training and streamlining which would reduce the variable production costs by 7% for the coming year? 39