Download
1 / 32
360 likes | 657 Views
Project Scheduling: PERT-CPM. PERT (Program evaluation and review technique) and CPM (Critical Path Method) makes a managerial technique to help planning and displaying the coordination of all the activities. Activity Description. Estimated Time. Immediate Predecessors. Activity. A B C

E N D
PERT(Program evaluation and review technique) andCPM(Critical Path Method) makes a managerial technique to help planning and displaying the coordination of all the activities.
Activity Description Estimated Time Immediate Predecessors Activity A B C D E F G H I J K L M N Excavate Lay the foundation Put up the rough wall Put up the roof Install the exterior plumbing Install the interior plumbing Put up the exterior siding Do the exterior painting Do the electrical work Put up the wallboard Install the flooring Do the interior painting Install the exterior fixtures Install the interior fixtures 2 weeks 4 weeks 10 weeks 6 weeks 4 weeks 5 weeks 7 weeks 9 weeks 7 weeks 8 weeks 4 weeks 5 weeks 2 weeks 6 weeks - A B C C E D E,G C F,I J J H K,L
Immediate predecessors: For any given activity, its immediate predecessors are the activities that must be completed by no later than the starting time of the given activity.
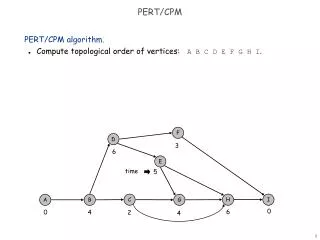
AOA (Activity-on-Arc): Each activity is represented by an arc. The arcs are used to show the precedence relationships between the activities.
START 0 (Estimated) Time 2 A arc node B 4 10 C D I 7 6 4 E 5 7 F G 8 J K L H 5 4 9 N M 2 6 0 FINISH
Path and Length START A B C D G H M FINISH 2 + 4 + 10 + 6 + 7 + 9 + 2 = 40 weeks START A B C E F J K N FINISH 2 + 4 + 10 + 4 + 5 + 8 + 4 + 6 = 43 weeks START A B C E F J L N FINISH 2 + 4 + 10 + 4 + 5 + 8 + 5 + 6 = 44 weeks Critical Path
Critical Path: A project time equals the length of the longest path through a project network. The longest path is called “critical path”. Activities on a critical path are the critical bottleneck activities where any delay in their completion must be avoided to prevent delaying project completion.
ES : Earliest Start time for a particular activity EF : Earliest Finish time for a particular activity
0 START 2 ES=0 EF=2 A B 4 ES=2 EF=6 10 C ES=6 EF=16 D I 7 ES=16 EF=23 6 4 ES=16 EF=22 ES=16 EF=20 E 7 5 ES=22 EF=29 ES=20 EF=25 G F 8 J H 9 K L 5 4 M 2 N 6 0 FINISH
If an activity has only a single immediate predecessor, then ES = EF for the immediate predecessor. Earliest Start Time Rule: The earliest start time of an activity is equal to the largest of the earliest finish times of its immediate predecessors. ES = largest EF of the immediate predecessors.
0 START ES=0 EF=2 2 A B 4 ES=2 EF=6 10 C ES=6 EF=1 D I 7 ES=16 EF=23 6 4 ES=16 EF=22 ES=16 EF=20 E 7 5 ES=22 EF=29 ES=20 EF=25 G F 8 J ES=25 EF=33 H 9 ES=29 EF=38 K 4 5 L ES=33 EF=37 ES=33 EF=38 M 2 ES=38 EF=40 N 6 ES=38 EF=44 0 FINISH ES=44 EF=44
LS: Latest Start time for a particular activity LF: Latest Finish time for a particular activity Latest Finish Time Rule: The latest finish time of an activity is equal to the smallest of the latest finish times of its immediate successors. LF = the smallest LS of immediate successors.
0 START LS=0 LF=0 2 LS=0 LF=2 A 4 B LS=2 LF=6 10 C LS=6 LF=16 D I 7 6 4 LS=18 LF=25 LS=20 LF=26 LS=16 LF=20 E 7 5 LS=26 LF=33 LS=20 LF=25 G F 8 J LS=25 LF=33 H 9 K 4 LS=33 LF=42 5 L LS=34 LF=38 LS=33 LF=38 M 2 LS=42 LF=44 N 6 LS=38 LF=44 0 FINISH LS=44 LF=44
Earliest Start Time Latest Start Time S=( 2, 2 ) F=( 6, 6 ) Latest Finish Time Earliest Finish Time
START 0 S=(0,0) F=(0,0) 2 S=(0,0) F=(2,2) A Critical Path 4 S=(2,2) F=(6,6) B S=(6,6) F=(16,16) C 10 7 S=(16,18) F=(23,25) D I 4 S=(16,16) F=(20,20) 6 S=(16,20) F=(22,26) E 5 7 S=(20,20) F=(25,25) S=(22,26) F=(29,33) G F S=(25,25) F=(33,33) 8 J H S=(29,33) F=(38,42) 9 K 4 S=(33,34) F=(37,38) L 5 S=(33,33) F=(38,38) M 2 S=(38,42) F=(40,44) N 6 S=(38,38) F=(44,44) 0 FINISH S=(44,44) F=(44,44)
Slack: A difference between the latest finish time and the earliest finish time. Slack = LF - EF Each activity with zero slack is on a critical path. Any delay along this path delays a whole project completion.
Three-Estimates Most likely Estimate (m) = an estimate of the most likely value of time. Optimistic Estimate (o) = an estimate of time under the most favorable conditions. Pessimistic Estimate (p) = an estimate of time under the most unfavorable conditions.
p o o m Beta distribution Mean : Variance:
Mean critical path: A path through the project network becomes the critical path if each activity time equals its mean. Activity OE M PE Mean Variance 1 2 3 2 A B C 2 1 4 8 4 6 9 18 10 OE: Optimistic Estimate M : Most Likely Estimate PE: Pessimistic Estimate
Activities on Mean Critical Path Mean Variance A B C E F J L N 2 4 10 4 5 8 5 6 1 4 1 1 1 Project Time
Approximating Probability of Meeting Deadline Assumption: A probability distribution of project time is a normal distribution. T = a project time has a normal distribution with mean and , d = a deadline for the project = 47 weeks.
Using a table for a standard normal distribution, the probability of meeting the deadline is P ( T d ) = P ( standard normal ) = 1 - P( standard normal ) = 1 - 0.1587 0.84.
Time - Cost Trade - Offs Crashing an activity refers to taking special costly measures to reduce the time of an activity below its normal value. Activity cost Crash Crash cost Normal Normal cost Crash time Normal time Activity time
Activity J: Normal point: time = 8 weeks, cost = $430,000. Crash point: time = 6 weeks, cost = $490,000. Maximum reduction in time = 8 - 6 = 2 weeks. Crash cost per week saved = = $30,000.
Maximum Reduction in Time (week) Crash Cost per Week Saved Time (week) Cost ($1,000) Activity N C N C 1 2 2 $180 $320 $430 A B J 2 4 8 1 2 6 $280 $420 $490 $100 $ 50 $ 30 N: Normal C: Crash
Using LP to Make Crashing Decisions Let Z be the total cost of crashing activities. A problem is to minimize Z, subject to the constraint that its project duration must be less than or equal to the time desired by a project manager.
= the reduction in the time of activity j by crashing it = the project time for the FINISH node
= the start time of activity j Duration of activity j = its normal time Immediate predecessor of activity F: Activity E, which has duration = Relationship between these activities:
Immediate predecessor of activity J: Activity F, which has time = Activity I, which has time = Relationship between these activities:
One Immediate Predecessor Two Immediate Predecessors Finish Time = 40 Total Cost = $4,690,000