Download

1 / 41
550 likes | 1.34k Views
Green Computing. Green Computing. Current system extremely wasteful Need energy to power Need energy to cool 1000 racks, 25,000 sq ft, 10MW for computing, 5MW to dissipate heat Need a system more efficient, less expensive strategy with immediate impact on energy consumption. Data Centers.

E N D
Green Computing • Current system extremely wasteful • Need energy to power • Need energy to cool • 1000 racks, 25,000 sq ft, 10MW for computing, 5MW to dissipate heat • Need a system more efficient, less expensive strategy with immediate impact on energy consumption
Data Centers • Focus by green computing movement on data centers (SUVs of the tech world) • 6,000 data centers in US • Consume 61B kWh of energy in 2006 • Cost: $4.5 B (more than used by all color TVs in US) • In 2007, DOE reported data centers 1.5% of all electricity in US • Greenhouse gas emission projected to more than double from 2007 to 2020
Data Centers • Within a few years, cost of power for data center was expected to exceed cost of original capital investment
Goal • Fed. Gov. wanted data center energy consumption to be reduced by at least 10% • Same as energy consumed by 1M average US households
Data Center Metrics • Metrics • SPECPowerjbb benchmark and DCiE from Green Grid • Green Grid – group of IT professionals • Power Usage Effectiveness PUE PUE = Total facility power/IT equipment power • Data Center infrastructure Efficiency metric DCiE 1/PUE
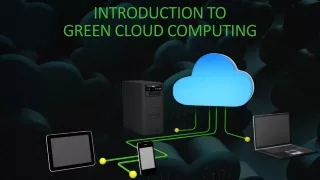
Future Vision • Sources of computing power in remote server warehouses • Located near renewable energy sources – wind, solar • Usage shifts across globe depending on where energy most abundant
Current approaches • Some “low hanging fruit” approaches • Orient racks of servers to exhaust in a uniform direction • Higher fruit - Microsoft • Built near hydroelectric power in WA • Built in Ireland - can air cool, 50% more energy efficient • Countries with favorable climates: Canada, Finland, Sweden and Switzerland
Current approaches • Google – trying to reduce carbon footprint Carbon footprint includes direct fuel use, purchased electricity and business travel, employee commuting, construction, server manufacturing • According to Google, its data centers use ½ industry’s average amount of power • How? Ultra efficient evaporative cooling (customized) • Yahoo (are they back??) • Data centers also carbon-neutral because of use of carbon offsets
Current approaches • US government • EPA has phase-one of Energy Star standards for servers • Measure server power supply efficiency and energy consumption while idle • Must also measure energy use at peak demand • Green Grid consortium • Dell, IBM, Sun VM-Wear AMD • Green500 – 500 most green supercomputers
Data Center Product Specification Completion • 2009 • Servers v1.0 • 2011 • Data Center Buildings Program • 2012 • UPS v1.0 (uninterruptable power supply) • 2013 • Servers 2.0 • Storage v1.0 • 2014 • Large Network Equipment v1.0 • 2015 • Data Center Cooling Equipment v1.0
Current approaches • Replace old computers with new more energy-efficient • But manufacturing through day-to-day uses energy • Dell - reducing hazardous substances in computers, OptiPlex 50% more energy efficient • Greenest computer company – VirtualBoxImages • What is “Greenest computer ever” ? • Is MacBook air (pro) greenest?
Goals for Future • Consider energy to manufacture, operate, dispose of • Sense and optimize world around us • Predict and respond to future events by modeling behavior (grown in performance) • Benefit of digital alternative to physical activities • E-newspapers, online shopping • Personal energy meter??
The Case for Energy-Proportional Computing Barroso and Holzle (Google)
Intro • Energy proportional computing primary design goal for servers • Cooling and provisioning proportional to average energy servers consume • Energy efficiency benefits all components • Computer energy consumption lowered if: • Adopt high-efficiency power supplies • Use power saving features already in equipment
Intro • More efficient CPUs on chips based on multiprocessing has helped • But, higher performance means increased energy usage
Laptops vs. Servers • Mobile device techniques • Multiple voltage planes, energy efficient circuit techniques, clock gating, dynamic voltage frequency scaling • Mobile high performance, short time followed by long idle interval • High energy efficiency at peak performance, low energy inactive states
Servers • Servers • Rarely completely idle • Seldom operate at maximum • 10-50% of max utilization levels • 100% utilization not acceptable for meeting throughput, etc. – no slack time
Servers • Completely idle server waste of capital • Difficult to idle subset of servers • Servers need to be available • Perform background tasks • Move data around • Can help recovery of crash • Applications can be restructured to create idle intervals • Difficult, hard to maintain • Devices with highest energy savings, highest wake-up penalty, e.g disk spin up
Energy Efficiency at varying utilization levels • Utilization – measure of performance normalized to performance at peak loads • Energy efficient server still consumes ½ power when doing almost no work • Power efficiency – utilization/power value • Peak energy efficiency occurs at peak utilization and drops as util. decreases • At 20-30% utilization, efficiency drops to less than ½ at peak performance
Toward energy-proportional machines • Mismatch between servers’ high-energy efficiency characteristics and behavior • Designers need to address this • Design machines that consume energy in proportion to amount of work performed • No power when idle (easy) • Nearly no power when little work (harder) • More as activity increases (even harder)
CPU power • Fraction of total server power consumed by CPU changed since 2005 • CPU no longer dominates power at peak usage, trend will continue • Even less when idle • Processors close to energy-proportional • Consume < 1/3 power at low activity (70% of peak) • Power range less for other components • < 50% for DRAM, 25% for disk drives, 15% for network switches
Dynamic range • Processors can run at lower voltage frequency mode without impacting performance • No other components with such modes • Only inactive modes in DRAM and disks • Inactive to active mode transition penalty (even it only idle to submilliseconds) • Servers with 90% dynamic range could cut energy by ½ in data centers • Lower peak power by 30% • Energy proportional hardware reduce need for power management software
Disks - Inactive/active • Penalty for transition to active from inactive state makes it less useful • Disk penalty 1000 higher for spin up than regular access latency • Only useful if idle for several minutes (rarely occurs) • More beneficial to have smaller penalty even if higher energy levels • Active energy savings schemes are useful even if higher penalty to transition because in low energy mode for longer periods
Conclusions • CPUS already exhibit energy proportional profiles, other components less so • Need significant improvements in memory and disk subsystems • Such systems responsible for larger fraction of energy usage • Need energy efficient benchmark developers to report measurements at nonpeak levels for complete picture
History of Green • In the 1970s • Energy crisis • High gas prices • Fuel shortages • Pollution • Education and action • Environmental activism • Energy awareness and conservation • Technological innovation
Gifts from the 70s • Energy crisis subsided • In the meantime advances in computing responsible for: • Innovation for energy-efficient buildings and cars • Identified causes and effects of global climate change • Grassroots activism, distributing info about energy consumption, carbon emission, etc. • The same computing technologies pioneered by hippie geeks (???) are the problem now
What happened next • Call to action within IT community (what about the 80s??) • In 1990s • General-purpose microprocessors built for performance • Competing processors • ever-increasing clock rates and transistor densities • fast processing power and exponentially increasing power consumption • Power wall at 130 watts • Power is a design constraint
Better, but also worse? • To reduce power consumption • Multicore architectures – higher performance, lower power budgets • But • Users expect performance doubling every 2 years • Developers must harness parallelism of multicore architectures • Power problems ubiquitous – energy-aware design needed at all levels
More problems • Memory architectures consume significant amounts of power • Need energy-aware design at systems level • Disks, boards, fans switches, peripherals • Maintain quality of computing devices, decrease environmental footprint • Can’t rely on nonrenewable resources or toxic ingredients
Those data centers • IT helping in data centers • Reducing energy with virtualization and consolidation • Need to address chip level device to heating/cooling of building • Need metrics
Yet another group • Metrics • SPECPowerjbb benchmark and DCiE from Green Grid • Green Grid – group of IT professionals • Power Usage Effectiveness PUE PUE = Total facility power/IT equipment power • Data Center infrastructure Efficiency metric DCiE 1/PUE • Benchmark acceptance takes time
Big government • US EPA Energy Star specification for servers • Will have impact • US gov. procurements required to purchase energy star machines (already true of monitors0 • May be further gov. regulations (with Dems in power ??) • EU implemented carbon cap and trade scheme, US to follow
Trade-off • How often to replace aging systems? • 2% of solid waste comes from consumer electronic components • E-waste fastest growing component of waste stream • In US 130,000 computers thrown away daily and 100 M cell phones annually • Recycle e-waste (good luck) • Use computers as long as possible?