EMU-wide automatic stabilisers
50 likes | 165 Views
This report by Georg Fischer, Director of Analysis, Evaluation, External Relations at DG Employment, Social Affairs, and Inclusion, delves into the weakening of automatic stabilizers (AS) within the European Monetary Union (EMU). It explores the contributions to nominal growth in gross disposable income of households across the Euro Area (EA17), highlighting a significant North/South divide in unemployment rates. The analysis also examines deviations in public social expenditure and GDP during recent recessions. Data sourced from Eurostat emphasizes how social expenditure significantly exceeded trend levels in recession years.

EMU-wide automatic stabilisers
E N D
Presentation Transcript
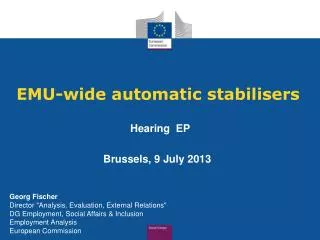
EMU-wide automatic stabilisers Hearing EP Brussels, 9 July 2013 Georg Fischer Director "Analysis, Evaluation, External Relations" DG Employment, Social Affairs & Inclusion Employment Analysis European Commission
Weakening of automatic stabilisation Contributions to nominal growth of gross disposable income of households (EA 17)
Striking North/South Divide • Unemployment rates (%) • Unemployment rates (%)
Chart – Deviation from the trend of public social expenditure and GDP output gap in current and past recessions EU27 and EA17 Weakening of AS: 2011 and 2012 Public social expenditure and GDP: deviations from the trend in current and past recessions Source : Eurostat, National Accounts, DG EMPL calculations. Note: 2012 data are estimated based on quarterly data from the first 3 quarters. In the current recession, N is year 2009. Estimates of the deviation from the trend in social protection expenditures are based on a standard Hodrick-Prescott filter. Reading notes : in the year of the recession, in the current crisis, social expenditure were around 5% above their trend in Europe, while the GDP was about 4% below its potential (output gap of -4%). Averages are unweighted country averages (since countries do not always experience a recession the same year).