Download
1 / 22
231 likes | 446 Views
Remote Sensing II Introduction. In Situ Data Collection.

E N D
In Situ Data Collection Scientists formulate hypotheses and then attempt to accept or reject them in a systematic, unbiased fashion. The data necessary to accept or reject a hypothesis may be collected directly in the field, often referred to as insitu or in-place data collection. This can be a time-consuming, expensive, and inaccurate process.
Problems Associated with In Situ Data Collection Scientists can collect data in the field using biased procedures often referred to as method-produced error. Such error can be introduced by: • sampling design does not capture the spatial variability of the phenomena under investigation (i.e., some phenomena or geographic areas are oversampled while others are undersampled); • improper operation of in situ measurement instruments; or • uncalibrated in situ measurement instruments.
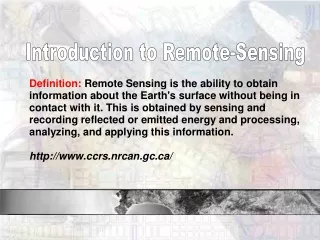
Remote Sensing Data Collection • ASPRS adopted a combined formal definition of photogrammetry and remote sensing as (Colwell, 1997): • “the art, science, and technology of obtaining reliable information about physical objects and the environment, through the process of recording, measuring and interpreting imagery and digital representations of energy patterns derived from noncontact sensor systems”.
A remote sensing instrument collects information about an object or phenomenon within the instantaneous-field-of-view (IFOV) of the sensor system without being in direct physical contact with it. The sensor is located on a suborbital or satellite platform.
Observations About Remote Sensing Is Remote Sensing a Science? A science is defined as the broad field of human knowledge concerned with facts held together by principles (rules). Scientists discover and test facts and principles by the scientific method, an orderly system of solving problems. Scientists generally feel that any subject that humans can study by using the scientific method and other special rules of thinking may be called a science. The sciences include 1) mathematicsandlogic, 2) the physical sciences, such as physics and chemistry, 3) the biological sciences, such as botany and zoology, and 4) the social sciences, such as geography, sociology, and anthropology.
Interaction Model Depicting the Relationships of the Mapping Sciences as they relate to Mathematics and Logic, and the Physical, Biological, and Social Sciences
Remote Sensing Data Collection The amount of electromagnetic radiance, L (watts m2sr1 , watts per meter squared per steradian) recorded within the IFOV of an optical remote sensing system (e.g., a picture element in a digital image) is a function of: L = f (λ, s x, y, z, t, Θ, P, Ω) where, λ = wavelength (spectral response measured in various bands or at specific frequencies) and…
Remote Sensing Data Collection sx,y,z = x, y, z location of the picture element and its size t= temporal information, i.e., when and how often the information was acquired q = set of angles that describe the geometric relationships among the radiation source (e.g., the Sun), the terrain target of interest (e.g., a corn field), and the remote sensing system P= polarization of back-scattered energy recorded by the sensor W = radiometric resolution (precision) at which the data (e.g., reflected, emitted, or back-scattered radiation) are recorded by the remote sensing system.
TemporalResolution Remote Sensor Data Acquisition June 1, 2008 June 17, 2008 July 3, 2008 16 days
RadiometricResolution 7-bit (0 - 127) 0 8-bit (0 - 255) 0 9-bit (0 - 511) 0 10-bit (0 - 1023) 0
Airborne Visible Infrared Imaging Spectrometer (AVIRIS) Datacube of Sullivan’s Island Obtained on October 26, 1998 Color-infrared color composite on top of the datacube was created using three of the 224 bands at 10 nm nominal bandwidth.
Angular Information • Remote sensing systems record very specific angularcharacteristics associated with each exposed silver halide crystal or pixel. The angular characteristics are a function of: • location in a 3-dimensional sphere of the illumination source (e.g., the Sun for a passive system or the sensor itself in the case of RADAR, LIDAR, and SONAR) and its associated azimuth and zenith angles, • orientation of the terrain facet (pixel) or terrain cover (e.g., vegetation) under investigation, and • location of the suborbital or orbital remote sensing system and its associated azimuth and zenith angles.
Angular Information There is always an angle of incidence associated with the incoming energy that illuminates the terrain and an angle of exitance from the terrain to the sensor system. This bidirectional nature of remote sensing data collection is known to influence the spectral and polarization characteristics of the at-sensor radiance, L, recorded by the remote sensing system.