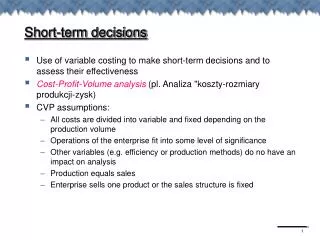
Short-term decisions
Short-term decisions. Use of variable costing to make short-term decisions and to assess their effectiveness Cost-Profit-Volume analysis ( pl . Analiza "koszty-rozmiary produkcji-zysk ) CVP assumptions : All costs are divided into variable and fixed depending on the production volume

Short-term decisions
E N D
Presentation Transcript
Short-term decisions • Use of variable costing to make short-term decisions and to assess their effectiveness • Cost-Profit-Volume analysis (pl. Analiza "koszty-rozmiary produkcji-zysk) • CVP assumptions: • All costs are divided into variable and fixed depending on the production volume • Operations of the enterprise fit into some level of significance • Other variables (e.g. efficiency or production methods) do no have an impact on analysis • Production equals sales • Enterprise sells one product or the sales structure is fixed
Variable costing - basis for the CVP analysis • P/L Statement using variable costing
Contribution margin x 100% Contribution margin ratio = Sales revenue 100 000 x 100% Contribution margin ratio = = 50 % 200 000 Sensitivity analysis with unchanged fixed costs. Contribution margin ratio • Sensitivity analysis • Analysing the impact of changes in variables on the decision taken • Sensitivity analysis with unchanged fixed costs • Impact of changes in sales volume on income from sales and the cover margin with unchanged fixed costs • Contribution margin ratio • Example:
Break-even point • Break-even point(pl. punkt krytyczny) • Amount of sales at which sales revenues equal total operating costs, that is income from sales equals zero • Calculating break-even point: • The graphic form • The equation method • The unit contribution method • Symbols used to signify variables: K – total costskz – unit variable cost k – unit costS – sales revenue Ks – fixed total cost p – price per unit ks – unit fixed costV – production volume Kz – variable total costZ – income
Income are zł Sales revenue Break-even point Total costs Loss area 120 000 Variable costs Cover margin 60 000 Fixed costs 0 1 200 unit Graphical representation of break-even point
Ks Vo = p - kz Equation method for calculating break-even point Income from sales = Sales revenue – Total costs • Assumptions: • Income from sales at break-even point = 0 • Sales revenue = price per unit x unknown sales volumeVo • Total costs = fixed total cost + unit variable cost x unknown sales volumeVo • Equation: 0 = p x Vo – Ks – kz x Vo p x Vo = Ks + kz x Vo Z = S - K Z = 0 S = p x Vo K = Ks + kz x Vo
Fixed costs Fixed costs Quantitative break-even point Break-even point (amount) = = Unit contribution margin Contribution margin ratio Unit contribution margin method • Unit cover margin • Share of one sold unit to the total cover margin • Unit cover margin method • How many unit cover margins must we have to cover fixed total costs?
(estimated) Sales volume Sales volume at break-even point - Quantitative M/S (MBszt.) = The margin of safety (M/S) • Safety margin • Defines, by how much can sales go down for the enterprise to find itself at the break-even point (estimated) Sales revenue Sales revenue at break-even point M/S (amount) (MBzł) - = M/S (amount) x 100% Percentage M/S (MB%) = (estimated) Sales revenue
Ks + a Ks + a Vo = Vo = p - kz JMNP Estimated income from sales • Sales volume at which estimated income from sales, Z, will be achieved: • How many contribution margins we must achieve in order to cover the estimated fixed costs and ensure required income from sales?
Income tax deducted from income from sales Fixed costs Sales revenue Variable costs Income from sales after tax - - = - (Estimated income from sales after tax)/ (1-r) + Ks = Sales volume JMNP Estimated income from sales after tax • What is the required sales volume in order to achieve the required income from sales after income taxes? where: Income tax = income from sales x tax rate r
Sensitivity analysis with changes in fixed costs. • Cost structure as an element of risk • Question: Is it better to operate on markets with high fixed costs required or on markets with low fixed costs but relatively high variable costs? • The higher the share of fixed costs in the total cost structure, the greater the operating risk of the enterprise
Assumption: the structure of variable and fixed costs in changing due to changes in production employees compensation from wages to salaries (2 000 units produced – fixed salary of 20 000 zł). Example – operating leverage (1)
Example – operating leverage(2) • Assumptions: production and sales will decrease by 10% in relation to an earlier assumption of 2 000 units. Prepare the new P/L Statements? • Result:The change in cost structure resulted in varying changes in income from sales given the same decrease in sales revenue. The company is more sensitive to changes in sales volume.
Contribution margin = Degree of operating leverage Income from sales % change in sales revenue x SDO % change in income from sales = Operating leverage • Operating leverage (pl. Dźwignia operacyjna) • Measure of the extent to which fixed costs are being used in an organization • The strength of operating leverage is higher in enterprises with greater share of fixed costs in comparison to variable costs – income is then more sensitive to changes in sales revenue • Degree of operating leverage • Measure of strength of operating leverage • By how much % will the income from sales change, at a given sales volume, if the sales revenue changes by 1%
Example – degree of operating leverage • What is the degree of operating leverage in "SIGMA” enterprise in these two different alternatives: • Results: In "SIGMA” enterprisea 10% decrease in sales resulted in a decline of income from sales by 25% and 30%, respectively • Operating leverage is a measure which management to quickly assess the impact of changes in sales volume on income from sales • Impact of operating leverage on income from sales in the highest near the break-even point