Download
1 / 19
200 likes | 910 Views
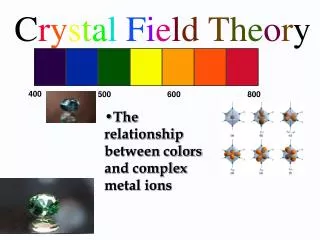
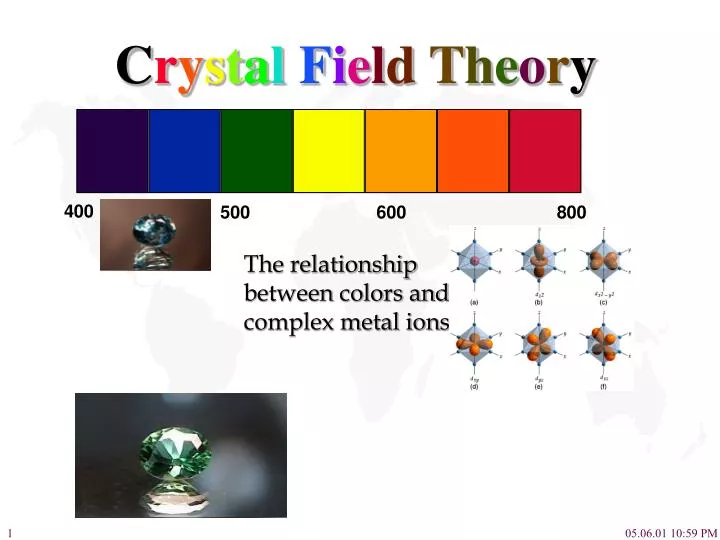
400. 500. 600. 800. C r y s t a l F i e l d T h e o r y. The relationship between colors and complex metal ions. Transition Metal Gems. Gemstone owe their color from trace transition-metal ions Corundum mineral, Al 2 O 3 : Colorless Cr Al : Ruby Mn Al: Amethyst

E N D
400 500 600 800 Crystal Field Theory • The relationship between colors and complex metal ions
Transition Metal Gems • Gemstone owe their color from trace transition-metal ions • Corundum mineral, Al2O3: Colorless • Cr Al : Ruby • Mn Al: Amethyst • Fe Al: Topaz • Ti &Co Al: Sapphire • Beryl mineral, Be3 Al 2Si6O18: Colorless • Cr Al : Emerald • Fe Al : Aquamarine
Crystal-Field Theory • Model explaining bonding for transition metal complexes • • Originally developed to explain properties for crystalline material • • Basic idea: • Electrostatic interaction between lone-pair electrons result in coordination.
Energetics • CFT - Electrostatic between metal ion and donor atom i i) Separate metal and ligand high energy ii) Coordinated Metal - ligand stabilized iii) Destabilization due to ligand -d electron repulsion iv) Splitting due to octahedral field. ii iv iii
Ligand-Metal Interaction • Crystal Field Theory - Describes bonding in Metal Complexes • Basic Assumption in CFT: • Electrostatic interaction between ligand and metal d-orbitals align along the octahedral axis will be affected the most. More directly the ligand attacks the metal orbital, the higher the the energy of the d-orbital. In an octahedral field the degeneracy of the five d-orbitals is lifted
d-Orbitals and Ligand Interaction(Octahedral Field) • Ligands approach metal d-orbitals pointing directly at axis are affected most by electrostatic interaction d-orbitals not pointing directly at axis are least affected (stabilized) by electrostatic interaction
Splitting of the d-Orbitals • Octahedral field Splitting Pattern: The energy gap is referred to as (10 Dq) , the crystal field splitting energy. The dz2 and dx2-y2 orbitals lie on the same axes as negative charges. Therefore, there is a large, unfavorable interaction between ligand (-) orbitals. These orbitals form the degenerate high energy pair of energy levels. The dxy , dyx and dxz orbitals bisect the negative charges. Therefore, there is a smaller repulsion between ligand & metal for these orbitals. These orbitals form the degenerate low energy set of energy levels.
Magnitude of CF Splitting ( or 10Dq) • Color of the Complex depends on magnitude of • 1. Metal: Larger metal larger • Higher Oxidation State larger • 2. Ligand: Spectrochemical series • Cl- < F- < H2O < NH3 < en < NO2- < (N-bonded) < CN- • Weak field Ligand: Low electrostatic interaction: small CF splitting. • High field Ligand: High electrostatic interaction: large CF splitting. Spectrochemical series: Increasing
Electron Configuration in Octahedral Field • Electron configuration of metal ion: • s-electrons are lost first. • Ti3+ is a d1, V3+ is d2 , and Cr3+ is d3 • Hund's rule: • First three electrons are in separate d orbitals with their spins parallel. • Fourth e- has choice: • Higher orbital if is small; High spin • Lower orbital if is large: Low spin. • Weak field ligands • Small , High spin complex • Strong field Ligands • Large , Low spin complex
High Spin Vs. Low Spin (d1 to d10) • Electron Configuration for Octahedral complexes of metal ion having d1 to d10 configuration [M(H2O)6]+n. • Only the d4 through d7 cases have both high-spin and low spin configuration. Electron configurations for octahedral complexes of metal ions having from d1 to d10 configurations. Only the d4 through d7 cases have both high-spin and low-spin configurations.
Color Absorption of Co3+ Complexes • The Colors of Some Complexes of the Co3+ Ion Complex Ion Wavelength of Color of Light Color of Complex light absorbed Absorbed [CoF6] 3+ 700 (nm) Red Green [Co(C2O4)3] 3+ 600, 420 Yellow, violet Dark green [Co(H2O)6] 3+ 600, 400 Yellow, violet Blue-green [Co(NH3)6] 3+ 475, 340 Blue, violet Yellow-orange [Co(en)3] 3+ 470, 340 Blue, ultraviolet Yellow-orange [Co(CN)6] 3+ 310 Ultraviolet Pale Yellow The complex with fluoride ion, [CoF6]3+ , is high spin and has one absorption band. The other complexes are low spin and have two absorption bands. In all but one case, one of these absorptionsis in the visible region of the spectrum. The wavelengths refer to the center of that absorption band.
Colors & How We Perceive it 650 580 800 560 400 Artist color wheel showing the colors which are complementary to one another and the wavelength range of each color. 430 490
Black & White When a sample absorbs light, what we see is the sum of the remaining colors that strikes our eyes. If a sample absorbs all wavelength of visible light, none reaches our eyes from that sample. Consequently, it appears black. If the sample absorbs no visible light, it is white or colorless.
650 580 750 560 400 490 430 Absorption and Reflection If the sample absorbs all but orange, the sample appears orange. Further, we also perceive orange color when visible light of all colors except blue strikes our eyes. In a complementary fashion, if the sample absorbed only orange, it would appear blue; blue and orange are said to be complementary colors.
Light absorption Properties of Metal Complexes • Recording the absorption Spectrum
650 580 800 560 400 430 490 Complex Influence on Color • Compounds of Transition metal complexes solution. [Fe(H2O)6]3+ [Ni(H2O)6]2+ [Zn(H2O)6]2+ [Co(H2O)6]2+ [Cu(H2O)6]2+
The complex with fluoride ion, [CoF6]3+ , is high spin and has one absorption band. The other complexes are low spin and have two absorption bands. In all but one case, one of these absorptionsis in the visible region of the spectrum. The wavelengths refer to the center of that absorption band. Color Absorption of Co3+ Complexes • The Colors of Some Complexes of the Co3+ Ion
dz2 dx2-y2 dx2-y2 dxy dxz dxy dyz dz2 dxz dyz dz2 dx2-y2 dyz dxz dxy Octahedral, Tetrahedral & Square Planar • CF Splitting pattern for various molecular geometry Octahedral Tetrahedral Square planar Mostly d8 (Majority Low spin) Strong field ligands i.e., Pd2+, Pt2+, Ir+, Au3+ Pairing energy Vs. Weak field < Pe Strong field > Pe Small High Spin
Summary • Crystal Field Theory provides a basis for explaining many features of transition-metal complexes. Examples include why transition metal complexes are highly colored, and why some are paramagnetic while others are diamagnetic. The spectrochemical series for ligands explains nicely the origin of color and magnetism for these compounds. There is evidence to suggest that the metal-ligand bond has covalent character which explains why these complexes are very stable. Molecular Orbital Theory can also be used to describe the bonding scheme in these complexes. A more in depth analysis is required however.