Download
1 / 26
260 likes | 412 Views
The carbon balance of Eurasia consolidated with eddy covariance observations. Michiel K. van der Molen Han Dolman Luca Belelli Marchesini Chiara Corradi Martin Heimann Takashi Kuwada Alexander V. Kononov Juliya Kurbatova Trofim Maximov Eddy Moors Taro Nakai Ernst-Detlef Schulze

E N D
The carbon balance of Eurasia consolidated with eddy covariance observations Michiel K. van der Molen Han Dolman Luca Belelli Marchesini Chiara Corradi Martin Heimann Takashi Kuwada Alexander V. Kononov Juliya Kurbatova Trofim Maximov Eddy Moors Taro Nakai Ernst-Detlef Schulze Olga Shibistova Takeshi Ohta Riccardo Valentini Andrej Varlagin Sergei Zimov
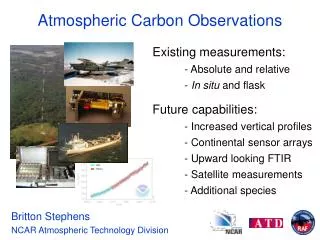
Open Science Conference on the GHG cycle in the Northern Hemisphere Crete, 15 November 2006 Faculty of Earth and Life Sciences vrije Universiteit Amsterdam TCOS-Siberia tower sites Chokurdakh tundra Tver 2x forest + bog Zotino forest + bog Cherskii floodplain tundra Yakutsk Larix + Pine forest Hakasia natural and regenerating steppe
Open Science Conference on the GHG cycle in the Northern Hemisphere Crete, 15 November 2006 Faculty of Earth and Life Sciences vrije Universiteit Amsterdam TCOS-Siberia tower sites • 12 sites in key ecosystem types • 47 site-years between 1998-2005 • nearly indentical instrumentation • Euroflux methodology
Open Science Conference on the GHG cycle in the Northern Hemisphere Crete, 15 November 2006 Faculty of Earth and Life Sciences vrije Universiteit Amsterdam Annual course of CO2 flux
Open Science Conference on the GHG cycle in the Northern Hemisphere Crete, 15 November 2006 Faculty of Earth and Life Sciences vrije Universiteit Amsterdam Seasonal cycles of CO2 flux
Open Science Conference on the GHG cycle in the Northern Hemisphere Crete, 15 November 2006 Faculty of Earth and Life Sciences vrije Universiteit Amsterdam Annual course of CO2 flux
Open Science Conference on the GHG cycle in the Northern Hemisphere Crete, 15 November 2006 Faculty of Earth and Life Sciences vrije Universiteit Amsterdam Land cover distribution in the RF Total land area: 17.1 x 10⁶ km2 or 11% of the global land area
Open Science Conference on the GHG cycle in the Northern Hemisphere Crete, 15 November 2006 Faculty of Earth and Life Sciences vrije Universiteit Amsterdam Upscaling to RF territory CO2 sink in RF: -1.9 Pg C yr-1 = NEP
Open Science Conference on the GHG cycle in the Northern Hemisphere Crete, 15 November 2006 Faculty of Earth and Life Sciences vrije Universiteit Amsterdam How large is this sink? • CO2 sink in RF (NEP): -1.9 Pg C yr-1 for comparison: • global fossil fuel burning : +6 Pg C yr-1 • (tropical) deforestation: +2 Pg C yr-1
Open Science Conference on the GHG cycle in the Northern Hemisphere Crete, 15 November 2006 Faculty of Earth and Life Sciences vrije Universiteit Amsterdam Why so much uncertainty: It’s all scales global change 10.000 km annual fluxes inter annual variability daily fluxes soil drying respiration changes 100 m half hour fluxes photosynthesis processes 20 cm micrometeorology eddies 10Hz 1 day annual 30 min
Open Science Conference on the GHG cycle in the Northern Hemisphere Crete, 15 November 2006 Faculty of Earth and Life Sciences vrije Universiteit Amsterdam Why so much uncertainty?flux calculation procedure
Open Science Conference on the GHG cycle in the Northern Hemisphere Crete, 15 November 2006 Faculty of Earth and Life Sciences vrije Universiteit Amsterdam Why so much uncertainty?gap-filling procedure
Open Science Conference on the GHG cycle in the Northern Hemisphere Crete, 15 November 2006 Faculty of Earth and Life Sciences vrije Universiteit Amsterdam Why so much uncertainty?gap-filling procedure
Open Science Conference on the GHG cycle in the Northern Hemisphere Crete, 15 November 2006 Faculty of Earth and Life Sciences vrije Universiteit Amsterdam Why so much uncertainty?u*-correction • night-time flux under-estimation • unknown, but sensitive threshold u* • u*-correction with unrepresentative data • possible double accounting
Open Science Conference on the GHG cycle in the Northern Hemisphere Crete, 15 November 2006 Faculty of Earth and Life Sciences vrije Universiteit Amsterdam Why so much uncertainty?
Open Science Conference on the GHG cycle in the Northern Hemisphere Crete, 15 November 2006 Faculty of Earth and Life Sciences vrije Universiteit Amsterdam Carbon balance • NEP = -1.9 Pg C yr-1 • The carbon balance may be characterized as slow in – fast out
Open Science Conference on the GHG cycle in the Northern Hemisphere Crete, 15 November 2006 Faculty of Earth and Life Sciences vrije Universiteit Amsterdam Carbon losses • NEP = -1.9 Pg C yr-1 Fires (van der Werf et al., 2006) • 0.7% of RF is annually burned • Lfire = ~ 0.19 Pg C yr-1 (10 %) direct emissions • Lfire = ~ 0.13 Pg C yr-1 ( 7 %) indirect emissions • Ldisturbance is unknown, but < Lfire,assume 50% of fires = 0.16 Pg C yr-1 • Lriver = 0.020 Pg C yr-1 ( 1 %) • Total emissions: 0.50 Pg C yr-1 Conclusion: the carbon content of Russian ecosystems increases with 1.4 Pg C yr-1 = NBE
Open Science Conference on the GHG cycle in the Northern Hemisphere Crete, 15 November 2006 Faculty of Earth and Life Sciences vrije Universiteit Amsterdam Comparison with top-down • Inverse modelling: (~right hand side) • -1.3 Pg C yr-1 (Philippe Bousquet et al., 1999) • -0.5 Pg C yr-1 (Gurney et al., 2002) • -0.4 Pg C yr-1 (Christian Rödenbeck et al., 2003) • -0.7 Pg C yr-1 (Wouter Peters, in prep)
Open Science Conference on the GHG cycle in the Northern Hemisphere Crete, 15 November 2006 Faculty of Earth and Life Sciences vrije Universiteit Amsterdam The meaning of NEP • stand age matters • but can not explain the observed NBE of -1.4 Pg C yr -1 • NEP=5 mol C m-2 yr-1 ~ 60 g C m-2 yr-1 • In our case: NEP ~ 200 g C m-2 yr-1 Schulze et al., Science, 2000
Open Science Conference on the GHG cycle in the Northern Hemisphere Crete, 15 November 2006 Faculty of Earth and Life Sciences vrije Universiteit Amsterdam Where does the carbon go? • forest inventories (left-hand side) +0.035 Pg C yr-1 (Houghton et al., 1987) - 0.49 Pg C yr-1 (Kolguchina and Vinson, 1993) −0.42±0.07 Pg C yr-1 (Nilsson et al., 2000, Shvidenko and Nilsson, 2003) • forest harvesting • 8000 km2 or 7% of area burned • 0.014 Pg C yr-1 (Shvidenko and Nilsson, 1994)
Where does the carbon go? Open Science Conference on the GHG cycle in the Northern Hemisphere Crete, 15 November 2006 Faculty of Earth and Life Sciences vrije Universiteit Amsterdam • Changes in NDVI are strong in • Boreal Eurasia • West Canada • ~35 % in 9 years • (Myneni et al., Nature, 1997)
Where does the carbon go? Open Science Conference on the GHG cycle in the Northern Hemisphere Crete, 15 November 2006 Faculty of Earth and Life Sciences vrije Universiteit Amsterdam • Changes in Carbon pools are • positive in Siberia • negative in Canada • (Myneni et al., PNAS, 2001)
Summer Why does the carbon go? Open Science Conference on the GHG cycle in the Northern Hemisphere Crete, 15 November 2006 Faculty of Earth and Life Sciences vrije Universiteit Amsterdam Winter • warming climate (also in summer) • longer growing seasons • the data do not suggest a short-term response to temperature variability Autumn (Chapin et al., Science, 2005)
Why does the carbon go? Open Science Conference on the GHG cycle in the Northern Hemisphere Crete, 15 November 2006 Faculty of Earth and Life Sciences vrije Universiteit Amsterdam 0h 6h 12h 18h 24h VPD • but • high temperature may cause high VPD • stomatal response to high VPD may be negative feedback to NEE 5 0 -10 -15 -20 0h 6h 12h 18h 24h CO2 flux May Jun Jul Aug Sep Oct
Summer Why does the carbon go? Open Science Conference on the GHG cycle in the Northern Hemisphere Crete, 15 November 2006 Faculty of Earth and Life Sciences vrije Universiteit Amsterdam Winter • changed land management practices: 218∙109 m2 or 8 % of the cultivated agricultural and grasslands were abandoned between 1992 and 2001 • CO2 fertilization Autumn
Open Science Conference on the GHG cycle in the Northern Hemisphere Crete, 15 November 2006 Faculty of Earth and Life Sciences vrije Universiteit Amsterdam Conclusions • NEP = -1.9 Pg C yr-1 • NBE = -1.4 Pg C yr-1 • bottom-up and top-down roughly agree • indications of C-storage in biomass • probable reasons: • warming climate, longer growing seasons • changed land use practices • CO2 fertilization