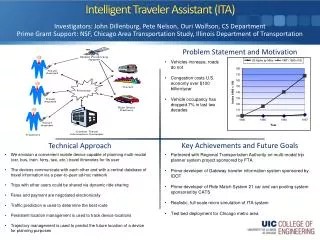
Download
1 / 36
380 likes | 526 Views
Intelliviz Intelligent telemetry data visualization assistant. Final briefing at NASA Ames 25 July 2008. Presented by: Jim Ong, John Mohammed { ong, mohammed } @stottlerhenke.com 650.931.2710, 916.688.1519 http://www.stottlerhenke.com. Agenda. Company Overview Project Goals

E N D
IntellivizIntelligent telemetry data visualization assistant Final briefing at NASA Ames 25 July 2008 Presented by: Jim Ong, John Mohammed { ong, mohammed } @stottlerhenke.com 650.931.2710, 916.688.1519 http://www.stottlerhenke.com
Agenda Company Overview Project Goals Phase 1 Tasks and Results Phase 2 Objective and Plan Benefits, Innovations, and Risks Intelliviz – intelligent telemetry data visualization assistant – final briefing at NASA Ames
Stottler Henke History Locations Mission Core competency Businesses Solution areas Personnel Founded 1988 by Dick Stottler, Andrea Henke San Mateo, CA; Seattle, WA; Boston, MA Solve problems that defy solution using traditional approaches Artificial intelligence Contract R&D, software products Education & training Planning & scheduling Decision support Knowledge management & discovery Autonomic computing 45 tech staff: 25% PhD, 45% MS/MA, 30% BS Intelliviz – intelligent telemetry data visualization assistant – final briefing at NASA Ames
Project Goals Enable users to maintain situation awareness and control Complement automation on-board and at mission operations center Help users and designers select relevant data and presentation formats to support user tasks and data analysis needs Develop an intelligent software assistant that creates telemetry data visualizations automatically Intelliviz – intelligent telemetry data visualization assistant – final briefing at NASA Ames
Phase I Tasks • Reviewed prior research in auto data visualization • Reviewed related R&D programs and missions • Identified requirements • Designed phase 2 software • Developed scenarios and test cases • 6. Developed software prototype • 7. Developed phase 2 plan Intelliviz – intelligent telemetry data visualization assistant – final briefing at NASA Ames
Prior Research: Auto Data Visualization Cleveland & McGill 84 MacKinlay 86 Larkin & Simon 87 Casner 90 Mackinlay 91 Kosak 93 Roth 94 Goldstein 94 Schneiderman 96 Graphical Perception Automated Design of Graphical Presentations Information Processing of Diagrams vs. Text Task Analytic Design of Graphical Presentations Search Architectures for Automated Design of Graphical Presentations Automated Layout of Network Diagrams Interactive Graphical Design Using Automated Presentation Knowledge Interactive Data Exploration System (IDES) Task by Data Type Taxonomy for Information Visualizations Intelliviz – intelligent telemetry data visualization assistant – final briefing at NASA Ames
Related R&D and Missions Demonstrated utility of task-specific visualizations Provided rationale and basis for cross-checking MBR diagnosis Helped us understand mission control practices, challenges for an experimental satellite Explored potential synergy – design-time or run-time assistance. Promising software framework for implementing Intelliviz ACAWS HyDE MBR Teams-RT MBR Gravity Probe-B Flight Control Automation for Operations Mission Control Technologies Intelliviz – intelligent telemetry data visualization assistant – final briefing at NASA Ames
End Users, Applications, Criteria Crew members Flight controllers System specialists Cross-check automated diagnoses Telemetry display during procedure execution Collaboration among flight controllers Need for Effectiveness, Flexibility > Need for Predictability End Users Applications Best Target Applications Intelliviz – intelligent telemetry data visualization assistant – final briefing at NASA Ames
Cross-Checking MBR Diagnoses • Insufficient instrumentation to discriminate among faults • Insufficient instrumentation to detect fault • Unanticipated fault mode • Unanticipated interaction between components • Signal processing provides unreliable pass/fail test • Detect incorrect mis-diagnoses • Correct diagnosis different from user intuition • Isolate specific fault • Isolate root cause Potential for MBR misdiagnosis Reasons for cross-checking Intelliviz – intelligent telemetry data visualization assistant – final briefing at NASA Ames
Mission Operations System Visualization Content Editors Signals Visualization Designer Questions, analysis goals Analysis Goals Visualization Goal Manager Intelliviz User Interface Visualization Design Manager Visualizations Visualizations User Profiles Telemetry Database Data catalog Reference Data System Models Analysis Goals Proposals Visualizations Visualization Design Specialists Visualization Content Objects, Templates System Design Intelliviz – intelligent telemetry data visualization assistant – final briefing at NASA Ames
Key Modules Visualization Goal Manager (VGM) Visualization Designer Visualization User Interface User Profile Tracks user tasks. Infers data analysis goals. Visualization Design Manager (VDM) manages visualization selection and layout. Visualization Design Specialists (VDMs) propose and generate visualizations. Accepts direct, indirect requests for visualizations. Exploits context to streamline user interaction. Enables tailoring to user-specific preferences. Intelliviz – intelligent telemetry data visualization assistant – final briefing at NASA Ames
Viz Goal Manager – Tracks User Tasks Inputs Outputs Task Model Heuristics Signals from mission ops software User commands Indications of user tasks Open tasks Possible next tasks Decomposition of tasks into subtasks Signals indicating start/end of task Classification of signals (system event, user command) Track when tasks start and stop Generate possible user subtasks Intelliviz – intelligent telemetry data visualization assistant – final briefing at NASA Ames
Viz Goal Manager - Goal Inference KB Variables Datasets Components Analysis Goal Types Heuristics Descriptions of variables available for visualization Associated with variables Attributes: role, data type, cardinality Associated with each variable Variables that characterize component’s operation Whether variables are inputs or outputs of component See current value of scalar, 1D, or N-dim variable Compare current values w/ each other or nom range Compare tuples of variables with reference model See variable’s history Compare history with reference model See functional, power, or monitoring/control topology Relate current values to topology of components Infer data analysis goals from user tasks Intelliviz – intelligent telemetry data visualization assistant – final briefing at NASA Ames
Viz Goal Manager – Sample Rule If Then User task = verify component, and VGM can determine input and output variables of the suspected component. Assert analysis goals to see the current value of each operational input and output variable. Assert lower-level user tasks to relate these current values to their nominal ranges, if any. Check if there is only one input and one output variable, and if so, Assert a user task to compare their current values to any known nominal reference multivariate relation. Intelliviz – intelligent telemetry data visualization assistant – final briefing at NASA Ames
Visualization Designer Algorithm Algorithm Characteristics 1. VDS accepts analysis goals from VGM. 2. VDM requests proposals from Visualization Design Specialists (VDSs). 3. VDM selects proposals that maximize visualization effectiveness and minimize cost. 4. VDSs generate selected visualizations Modular – can extend to support new visualizations. Flexible – accommodate VDSs using diverse knowledge and algorithms. Variable automation – ranging from manually-designed to highly customized at run-time. Intelliviz – intelligent telemetry data visualization assistant – final briefing at NASA Ames
Iterative Selection of Visualizations One graph per analysis goal Unfilled bars show unselected visualizations Colors bars show selected visualizations Gray bar shows goal’s importance Intelliviz – intelligent telemetry data visualization assistant – final briefing at NASA Ames
Visualization Design Specialists Tables Meters Intelliviz – intelligent telemetry data visualization assistant – final briefing at NASA Ames
Visualization Design Specialists Bar Charts XY Scatterplots Time Series Intelliviz – intelligent telemetry data visualization assistant – final briefing at NASA Ames
Visualization Design Specialists Schematics Distribution Tree Bar Chart Intelliviz – intelligent telemetry data visualization assistant – final briefing at NASA Ames
Scenario 1 – Corroded Relay Contacts Situation Analysis Goals Candidate Visualizations Selected Corrosion or foreign matter between contacts of relay switch controlling thermal loop pump causes higher resistance and lower pump voltage. FP detects low coolant flow rate. MBR diagnoses problem with pump. From user task: Verify Pump. VGM generates goals to view values of pump’s differential pressure and impeller speed, relate these to nominal ranges and nominal relation curve. Meters, Bar charts, Table & Scatterplot Meters & Scatterplot Intelliviz – intelligent telemetry data visualization assistant – final briefing at NASA Ames
Scenario 1 – Corroded Relay Contacts Intelliviz – intelligent telemetry data visualization assistant – final briefing at NASA Ames
Scenario 2 – Mis-calibrated Sensor Situation Analysis Goals Candidate Visualizations Selected Current sensor for EPS device is mis-calibrated, reporting higher than normal values. See values of current along distribution path Relate to topology of distribution path. See power distribution tree. Schematic of power distribution topology with current values overlaid. Distribution tree bar chart showing power distribution. Table of current values. Schematic & distribution tree bar chart. Intelliviz – intelligent telemetry data visualization assistant – final briefing at NASA Ames
Scenario 2 – Mis-calibrated Sensor Intelliviz – intelligent telemetry data visualization assistant – final briefing at NASA Ames
Scenario 3 – Degraded Battery Capacity Situation Analysis Goals Candidate Visualizations The battery operates, accepting and providing charge, but it loses charge earlier than expected. MBR correctly diagnoses battery failure which enables safing procedure to use redundant battery. However, this does not explain why the battery failed (shorter charge cycle, lower charge current, higher discharge current, or degraded battery capacity?) See failed battery voltage history. Relate to nominal reference curve. See nominal battery voltage history. Relate to nominal reference curve. Time sequence graphs of voltages over complete charge/discharge cycle Intelliviz – intelligent telemetry data visualization assistant – final briefing at NASA Ames
Scenario 3 – Degraded Battery Capacity Intelliviz – intelligent telemetry data visualization assistant – final briefing at NASA Ames
Scenario 4 – Same Data, Alternate Views Situation Data Intelliviz selects different visualizations for the same data when analysis goals are varied across four test cases. The primary variation is the “priority” associated with each analysis goal. Current values and range limits of pump voltage and pump speed for three similar pumps/ Functional topology of pump interconnections. Intelliviz – intelligent telemetry data visualization assistant – final briefing at NASA Ames
Scenario 4 – Same Data Alternate Views Analysis Goals 1. View current values of voltage, speed for pumps 2. Relate current values to reference ranges 3. Relate current values to locations in the functional topology diagram where they are measured 4. Relate current voltage values from distinct pumps 5. Relate current speed values from distinct pumps 6. Relate (voltage, speed) current value tuples from distinct pumps to each other and to nominal reference curve Intelliviz – intelligent telemetry data visualization assistant – final briefing at NASA Ames
Alt View 1 - Relate Values to Ref Range Intelliviz – intelligent telemetry data visualization assistant – final briefing at NASA Ames
Alt View 2 - View Current Values, Topology Intelliviz – intelligent telemetry data visualization assistant – final briefing at NASA Ames
Alt View 3 - View Speed, Voltage with Each Other Across Pumps and vs. Reference Curve Intelliviz – intelligent telemetry data visualization assistant – final briefing at NASA Ames
Alt View 4 - View Speed, Voltage Across Pumps Intelliviz – intelligent telemetry data visualization assistant – final briefing at NASA Ames
Timeline Display of Gravity Probe B Data Intelliviz – intelligent telemetry data visualization assistant – final briefing at NASA Ames
Phase II Objective and Plan Objective Version 1 Version 2 Version 3 Develop operational prototype of Intelliviz at technology readiness level 6 to demonstrate its feasibility, utility, and usability by a NASA-relevant user community and task area. Baseline end-to-end functionality, limited scenarios, demo Extended coverage of situations and visualizations, leave-behind for test usage by NASA user group Operational prototype, supports extended usage Intelliviz – intelligent telemetry data visualization assistant – final briefing at NASA Ames
Intelliviz Risks Risk Cannot generate “good” visualizations Cannot infer or accept analysis goals Knowledge base is hard to maintain Automated visualization is disorienting Risk Assessment, Mitigation Selection algorithms can be parameterized. Can specify methods for setting parameters. User profiles encode preferences. Can create general or specific Specialists. Goal inference demonstrated. Menus allow user selection of generic goals elaborated automatically from context. Visualization Designer is modular, extensible. Visualization Goal Manager less understood. Can configure degree of automation. Can use as design time tool vs. run-time. Should carefully select target users, task areas. Intelliviz – intelligent telemetry data visualization assistant – final briefing at NASA Ames
Intelliviz Benefits Decision Support Complement Automated Reasoning Support Off-Line Visualization Design Helps users assess situations more quickly and accurately. Helps users understand and cross-check reasoning systems, increasing trust and acceptance. Help human user interface developers identify, evaluate, and select visualizations. Intelliviz – intelligent telemetry data visualization assistant – final briefing at NASA Ames
Intelliviz Innovations Auto selection and generation of visualizations Infer goals from contextual information Modular, extensible architecture Generic framework Two step process: Infer, accept analysis goals Generate visualizations to satisfy goals Using knowledge of tasks, systems, other mission-relevant concepts Scales to support diverse analysis goals, types of visualizations Can create multiple applications that support diverse users, task areas, visualizations Intelliviz – intelligent telemetry data visualization assistant – final briefing at NASA Ames