Download

1 / 26
260 likes | 388 Views
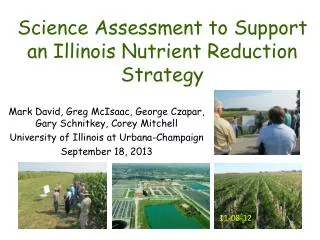
Science Assessment to Support an Illinois Nutrient Reduction Strategy. Mark David, George Czapar, Greg McIsaac, Corey Mitchell March 11, 2013. 11-08-12. Technical Tasks. develop a science based technical assessment of:

E N D
Science Assessment to Support an Illinois Nutrient Reduction Strategy Mark David, George Czapar, Greg McIsaac, Corey Mitchell March 11, 2013 11-08-12
Technical Tasks • develop a science based technical assessment of: • current conditions in Illinois of nutrient sources and export by rivers in the state from point and non-point sources • methods that could be used to reduce these losses and estimates of their effectiveness throughout Illinois • estimates of the costs of statewide and watershed level application of these methods to reduce nutrient losses to meet TMDL and Gulf of Mexico goals
Steps we will take • determine current conditions • identify critical watersheds • estimate potential reductions and costs • develop scenarios
1. Current Conditions • nutrient (nitrate and total P) loads from major river basins of Illinois • estimates of point and non-point sources • compare 1980-1996 with 1997-2010 • determine direction of loads • determine current agricultural management practices across the state • nutrient inputs and management (fertilizers and manure) • current cropping practices • P losses from water quality data • nutrient balances
N and P Fluxes for State, 1980 to 1997 From David and Gentry (2000)
Annual N Fertilizer Applications Fertilizer (kg N ha-1) 0.0 - 11.2 11.3 - 27.2 27.3 - 45.4 45.5 - 65.9 From David et al. (2010) 66.0 - 107.1
Tile drainage is concentrated in the corn belt Fraction of county From David et al. (2010)
Net N Inputs (NNI) kg N ha-1 Some counties negative, N from soil mineralization
Row Crop % Fertilizer P Net P Inputs Manure P From Jacobson et al. (2011)
Sewage Effluent -12.9 million people 16% of total N load statewide 21% for Illinois River, 14% for others 47% of total P load statewide 70% for Illinois River, 33% for others From David and Gentry (2000)
2. Critical Watershed Identification • identify 8 digits HUCs with the highest nutrient yields and loads to the Gulf of Mexico • identify watersheds with nutrient impaired water bodies (303d list) • determine overlap • estimate point and non-point sources of N and P within watersheds
January to June Nitrate-N Yield Adapted from David et al. (2010)
Modeled January to June Total P From Jacobson et al. (2011)
3. Estimate Potential Reductions and Costs • estimate field-level effectiveness of various agricultural management practices • utilize SAB, Iowa, and Lake Bloomington Project estimates • involve scientific panel from throughout the state • determine possible point source reductions • estimate costs • agricultural economist will lead • initial investments • annualized costs over 25 years
Nitrogen reduction practices • in-field • rate, source, time of application • nitrification inhibitor • cover crops • edge-of-field • drainage water management • wetlands, bioreactors, buffers • land use • extended rotations • land retirement: pasture, energy crops, perennials
Phosphorus Reduction Practices • in-field • rate and source of application • incorporation and tillage • cover crops • edge-of-field • buffers • land use • extended rotations • land retirement: pasture, energy crops, perennials
4. Develop Scenarios • combine possible point source reductions and field level agricultural reductions • percent reduction by practice • costs of implementation • target 45% reductions in N and P • scale-up to critical watersheds and statewide • provide a range of scenarios to meet reduction targets • area needed by practice • initial investment and annualized costs