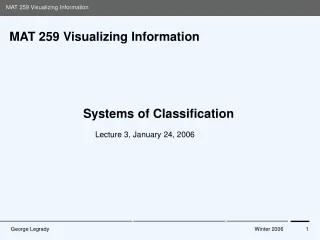
MAT 259 Visualizing Information
MAT 259 Visualizing Information. Discipline Specific Definitions. Discipline Specific Visualizations. Each discipline has a particular implementation goal Information Visualization : Analyzing and transforming nonspatial data into visual form for cognition

MAT 259 Visualizing Information
E N D
Presentation Transcript
MAT 259 Visualizing Information Discipline Specific Definitions George Legrady
Discipline Specific Visualizations Each discipline has a particular implementation goal • Information Visualization: Analyzing and transforming nonspatial data into visual form for cognition • Scientific Visualization: Map physical phenomena in 2D, or 3D • Geographic Information Systems (GIS): Cartographic framework, a familiar way to map data • LIS: citation indexing, bibliographic indexing, etc. • Art: Aesthetics, complexity, culturally meaningful results • Architecture: to convey information & affect George Legrady
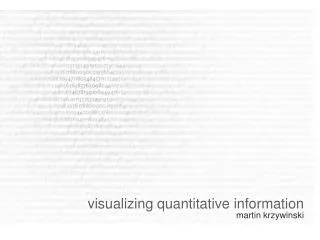
Information Visualization • Visually map abstract, non-spatial data to analyze and understand data. • Focus on abstract data sets that do not have inherent 2D or 3D geometrical properties on their own • A general term that can cover a broad range of developments: data visualization, information graphics, knowledge visualization, etc. • A creative approach to convey abstract information in intuitive ways. • Involves processing of large datasets as a means to reveal meaningful patterns. George Legrady
Information Visualization (Timm Kekeritz) George Legrady
Information Visualization (Timm Kekeritz) George Legrady
Information Visualization (Cost of Nation Rebuild…) George Legrady
Scientific Visualization • Interdisciplinary branch of science, concerned with visualizing 3D or time based phenomena • Emphasis on realistic rendering of volume, surfaces, illumination sources • Mapping phenomena such as medical biological meteorological systems • Graphical representation of numerical data for qualitative and quantitative analysis • Computer simulation of abstract models of a system, mathematical modeling of natural systems from physics, chemistry, biology, George Legrady
Scientific Visualization George Legrady
GIS (Geographical Information Systems) • Any information system that integrates stores, analyzes, displays geographical information • Analyze spatial information, maps • Cartography: Combines science, aesthetics, and technical processes to communicate information. • Cartographic modeling: Uses topology, and attribute information George Legrady
MAPPING: handmaps.org George Legrady
LIS (Library Information Science) • LS applies practices, perspectives, tools of information technology and management to libraries • Focus on how people interact with classification systems and technology • How information is acquired, evaluated, and classified • Citation indexing, bibliographic indexing George Legrady
LIS (Library Information Science) George Legrady
LIS (Library Information Science) George Legrady
Information Design, Information Graphics • Information design, a subset of graphic design • The intent is to display information effectively • Sometimes the visual effect dominates George Legrady
Information Design; Finance (Buro X) George Legrady
Information Design, Information Graphics • Information design, a subset of graphic design • The intent is to display information effectively George Legrady
Media A: Diagrammatic Narrative George Legrady
Art: Sol Lewitt (Wall Drawing – Mass MOCA) George Legrady
Art: Agnes Denes (11000 trees) George Legrady
Art: Lisa Jevbratt (1:1 Interface) George Legrady
Art: Lisa Jevbratt (The voice) George Legrady
Music: Notation (Xenakis – Metastatis) George Legrady
Music: Notation (Ligeti) George Legrady
Film Notation: Anthony McCall George Legrady
Film Notation: Anthony McCall George Legrady
Film: Daniel Aubert (farbtrennung) George Legrady
Architecture (Data driven) George Legrady
Architecture (Data driven – Zaha Hadid) George Legrady
References George Legrady