Download
1 / 25
250 likes | 399 Views
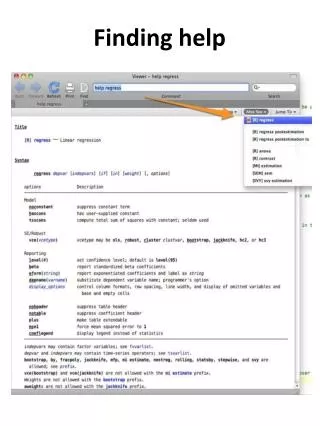
Finding help. Stata manuals. You have all these as pdf ! Check the folder /Stata12/docs. ASSUMPTION CHECKING AND OTHER NUISANCES. In regression analysis with Stata In logistic regression analysis with Stata NOTE: THIS WILL BE EASIER IN Stata THAN IT WAS IN SPSS.

E N D
Stata manuals You have all these as pdf! Check the folder /Stata12/docs
ASSUMPTION CHECKING AND OTHER NUISANCES • In regression analysis with Stata • In logistic regression analysis with Stata NOTE: THIS WILL BE EASIER IN Stata THAN IT WAS IN SPSS
Assumption checking in “normal” multiple regression with Stata
Assumptions in regression analysis • No multi-collinearity • All relevant predictor variables • included • Homoscedasticity: all residuals are • from a distribution with the same variance • Linearity: the “true” model should be • linear. • Independent errors: having information • about the value of a residual should not • give you information about the value of • other residuals • Errors are distributed normally
FIRST THE ONE THAT LEADS TO NOTHING NEW IN STATA (NOTE: SLIDE TAKEN LITERALLY FROM MMBR) Independent errors: havinginformationabout the value of a residualshouldnotgiveyouinformationabout the value of otherresiduals Detect: askyourselfwhetherit is likelythatknowledgeaboutoneresidualwouldtellyousomethingabout the value of anotherresidual. Typical cases: -repeatedmeasures -clusteredobservations (peoplewithinfirms / pupilswithin schools) Consequences: as forheteroscedasticity Usually, yourconfidenceintervals are estimatedtoosmall (thinkaboutwhythat is!). Cure: usemulti-level analyses part 2 of this course
The rest, in Stata: Example: the Stata “auto.dta” data set sysuse auto corr (correlation) vif (variance inflation factors) ovtest (omitted variable test) hettest (heterogeneity test) predict e, resid swilk (test for normality)
Finding the commands • “help regress” • “regress postestimation” and you will find most of them (and more) there
Multi-collinearity A strongcorrelationbetweentwoor more of your predictor variables Youdon’t want it, because: • It is more difficult to gethigher R’s • The importance of predictorscanbedifficult to establish (b-hatstend to go to zero) • The estimatesforb-hats are unstableunderslightly different regressionattempts (“bouncingbeta’s”) Detect: • Look at correlation matrix of predictor variables • calculateVIF-factorswhile running regression Cure: Delete variables sothatmulti-collinearitydisappears, forinstancebycombiningtheminto a single variable
Stata: calculating the correlation matrix (“corr” or “pwcorr”) and VIF statistics (“vif”)
Misspecification tests(replaces: all relevant predictor variables included) Also run “ovtest, rhs” here. Both tests should be non-significant. Note that there are two ways to interpret “all relevant predictor variables included”
Homoscedasticity: all residuals are from a distribution with the samevariance This can be done in Stata too (check for yourself) Consequences: Heteroscedasticiy does notnecessarilylead to biases in yourestimatedcoefficients (b-hat), butit does lead to biases in the estimate of the width of the confidence interval, and the estimation procedure itself is notefficient.
Testing for heteroscedasticity in Stata • Your residuals should have the same variance for all values of Y hettest • Your residuals should have the same variance for all values of X hettest, rhs
Errorsdistributednormally Errorsshouldbedistributednormally (justthe errors, not the variables themselves!) Detect: look at the residual plots, test fornormality, or save residualsand test directly Consequences: rule of thumb: ifn>600, noproblem. Otherwiseconfidenceintervals are wrong. Cure: try to fit a bettermodel (or use more difficultways of modelinginstead- askan expert).
Errorsdistributednormally First calculate the errors (after regress): predict e, resid Then test for normality swilke
Assumption checking in logistic regression with Stata Note: based on http://www.ats.ucla.edu/stat/stata/webbooks/logistic/chapter3/statalog3.htm
Assumptions in logistic regression • Y is 0/1 • Independence of errors (as in multiple regression) • No cases where you have complete separation (Stata will try to remove these cases automatically) • Linearity in the logit (comparable to “the true model should be linear” in multiple regression) – “specification error” • No multi-collinearity (as in m.r.) Think!
Think! • What will happen if you try logit y x1 x2 in this case?
This! Because all cases with x==1 lead to y==1, the weight of x should be +infinity. Stata therefore rightly disregards these cases. Do realize that, even though you do not see them in the regression, these are extremely important cases!
(checking for)multi-collinearity • In regression, we had “vif” • Here we need to download a command that a user-created: “collin” (try “finditcollin” in Stata)
(checking for)specification error • The equivalent for “ovtest” is the command “linktest”
Further things to do: • Check for useful transformations of variables, and interaction effects • Check for outliers / influential cases: 1) using a plot of stdres (against n) and dbeta(against n) 2) using a plot of ldfbeta’s(against n) 3) using regress and diag (but don’t tell anyone that I suggested this)
Checking for outliers … check the file auto_outliers.do for this …