Introduction to Challenges in System and SoC Debug
250 likes | 509 Views
Introduction to Challenges in System and SoC Debug. DAC System and SoC Debug Workshop, June 8, 2008 Dr. Neal Stollon, HDL Dynamics neals@hdldynamcs.com. First the good news. Lots of Design for Debug standards activity OCP-IP has released Debug Interface spec

Introduction to Challenges in System and SoC Debug
E N D
Presentation Transcript
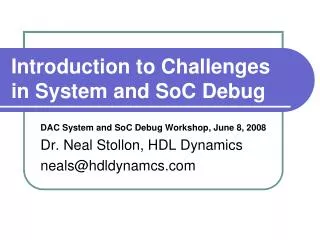
Introduction to Challenges in System and SoC Debug DAC System and SoC Debug Workshop, June 8, 2008 Dr. Neal Stollon, HDL Dynamics neals@hdldynamcs.com
First the good news Lots of Design for Debug standards activity OCP-IP has released Debug Interface spec Power.org has released Debug spec SPRINT has released Debug API spec Nexus, 1149.7 set to release specs by COB 2008 Lots of DfD industry activity More on-chip debug IP and interfaces are now the norm for higher end embedded parts
3 Challenges • Challenge 1 - User Perception Debug capabilities as key features • Challenge 2 – Intra-Domain Integration Better multi-vender SoC debug Interoperability • Challenge 3 – Inter-Domain Integration Closer integration with EDA, test, software worlds for win-win SoC solutions
Challenge 1 DfD perception as a necessary evil vs. value added feature “Debug features are only needed by engineers who make errors!” Limited users for HW debug = Why waste silicon ?? Debug infrastructure bar goes up with complexity - RAM vs. IO Bandwidth tradeoffs
Challenge 1 • More painless solutions (automation) • Software is king Better visualization Localizing problems • HW should be interoperable Migration from JTAG • 3rd party value vs. in-house solutions
SoC On Chip Debug Evolution JTAG (Scan, BIST Run Ctrl) Embedded Processor / Logic Trace Multi-Core Embedded System Debug Debug- Innovation ICE BDM Platform SoC(Multi-Core) 50K 20K 8K 2.5K 1K Debug- Difficulty Metric (total gates/pins) SoC (RISC+IP +RAM) ASICS System FPGA (PLD+RISC IP) Embedded Systems Single processor FPGAs 1980s 1990s 2000s The New Frontier • Embedded Debug Complexity increasing on log scale • Gates increase geometrically - Pins increase linearly • Significant debug difficulties for complex architectures • More complex debug needs new Instrumentation approaches
The Debug Landscape • Tool Level of Integration • SW/EDA Tool level APIs • HW tools level APIs Debug Software SPIRIT • IO Level of Integration • JTAG – different flavors Nexus 5001 MIPI NIDnT CJTAG Probe MIPI TAP IJTAG • Protocol Level of Integration • Nexus 5001 Multicore IP & probe APIs Other Proprietary Nexus Power.org System Level Debug Communications (SoC level run control, Cross-triggers, etc.) Multicore Trace formats SPRINT OCP • Instrument Level Many vendor/IP solutions CoreSight™ MIPS EJTAG MCDS Nexus Bus Analyzers Bus Fabric Core Analyzers Core A Core B
Challenge 2 The DfD community is still internally fractured Many groups reinventing the same wheels Little to no inter-company commonality on instrument interface/tool feature/API infrastructure What is driving incentives to common interfaces?? MIPI Roadmap Does this converge to a DfD Industry Roadmap ? Nexus Roadmap OCP-IP Roadmap Will design community adopt Without an Industry Roadmap ? POWER.ORG Roadmap SPIRIT Roadmap . . .
Challenge 2 Many Roadmaps vs Industry roadmap Diverging IO …parallel, Serdes Differing processor trace capabilities, formats Differing bus debug capabilities Emerging debug solutions for multicore Common, low cost debug solutions for low end MCUs Basic MCU in 3-5 years will differ from today
Debug Software and Tools Infrastructure • REQUIREMENTS • Define standardized • Tool to tool debug APIs • Tool to HW APIs • EDA to Debug Interfaces Nexus IO MIPI IO SerDes IO JTAG IO • Define standardized • Debug IP to Debug IO • Templates – Decouple • Debug IP from debug IO Common Debug IP Infrastructure SPRINT Interfaces SPIRIT Interfaces • Define standardized • Hardware protocols • Common debug • interfaces • Level set of features • Compatible with many • system debug options Coresight Subsystem MCDS Subsystem Nexus Subsystem MIPI Subsystem 1149.7 Subsystem The Target : Hitting Range of Debug Solutions
Challenge 3 System and SoC Debug is still an island to the greater EDA/Test community Integration with other aspects of design and verification flow are limited and adhoc. Why – SW centric focus, need for IP, lower margins Debug breakthroughs will occur in conjunction with EDA community EDA venders are starting to see the opportunity beyond emulation Synplicity – Identify Novas - Verdi
Challenge 3 SoC Debug is Test issue SoC Debug is Design Optimization issue SoC Debug is Verification issue How to we annotate simulation analysis with debug data? How can we reuse testbenches and assertions to automate debug? Ex. GDB is used for debug. GDB is used in ESL. Who has a common GDB mechanism to integrate ESL and Debug?
Next Stage Debug Challenges:Integrating ESL and Debug Eclipse Framework ESL Virtual SoC SW-level Debug HW-level Debug Data Transaction Debug Transaction Triggers Simulation HW Analyzers RISC JTAG DB Reader Soft Trace DB IP Assertions DB Writer Mem SW Debuggers Trace DSP SPIRIT IP_XACT XML Bus Monitors XML Embedded SW XML Correlation Inferences SoC Bus & Sockets JTAG TRACE DB Reader S M D D S M D D S M D D S D Hard Trace DB DB Writer DSP Mem RISC IP Assertions Trace JTAG Bus Monitor Triggers SCAN JTAG DFT JTAG /Nexus RTL/Physical SoC Adopted from Alan Su Springsoft
ESL/Instrumentation Flows Eclipse GUI Framework • SystemC • Analysis (DUST) • Model Frameworks • GreenBus • GDB • Trace • Breakpoints • Run Control • GCC++ IDEs • processor only • ISS Simulation MDI, GDI, RDI Instrumentation Tools - Probe Config, Display JTAG, Trace Port Interfaces Instrumentation IP (RTL HW) • Processor • Debug block • System • Bus, Memory Debug • Rest of the chip
Integrating Nexus Of some interest DSNOC’’08: Diagnostic Services in Network-on-Chips (DSNOC) Workshop, June 9 TLM Modeling Workshop June 9 Breakfast See Mark Burton, GreenSoCs
OCP-IP Debug Status and Plans DAC System and SoC Debug Workshop, June 8, 2008 Dr. Neal Stollon, HDL Dynamics neals@hdldynamcs.com
OCP Debug Working Group • OCP is neutral On Chip Protocol for SoC IP connection • WG focus on defining debug related signaling between cores and other embedded subsystems • Leverage other work for IOs (JTAG, Nexus), APIs, etc. • Defined subset architecture for on chip debug Baseline Sockets 1149.1 JTAG Debug resets Generic Processor debug handshakes Cross Trigger Interfaces Synchronize Trace/Debug Trace Triggers TimeStamp Interfaces Power Management Debug Security OCP 2.1 Socket OCP Debug Socket OCP Fabric b OCP Fabric RISC RISC Mem Ctrlr Mem Ctrlr DSP DSP RAM RAM Other IP Other IP Other IP Other IP Standardized transfer socket Master or slave, with optional bursting, thread signals not be same Debug Features For all sockets are optional
Debug Socket for Multi-Core Debugging OCP-IP Debug WG announces the release of its Debug Standard. The new standard identifies Basic and Extended sets of socket level signals for debugging of multiple processor cores connected with the OCP interface. The standard represents a breakthrough allowing designers to distribute debug signals as part of the system interface scheme; rather than wired separately from the data path as had been previously been the case. This innovative new approach greatly enhances system providers ability to prepare multi-core debug hardware and software.
What is in the Debug Specification? OCP Interface for Basic Debug Signals • Debug Control and Run Control for Cores • Consistent (multiple) processor software debugger interfaces • Cross-Triggering between Multiple Cores and Events • Scalable to on-chip/off-chip cross triggering • Trace Interface • Bus traffic observation (system trace) and control (triggering) • New classes of debug errors (different from system errors) OCP Interface for Extended Signals (Special features) • Performance Monitor • Time-stamping • Power Monitoring voltage islands, gated clock islands • Security islands Of huge valuein final silicon
Debug-IP HW connections to SoC: 1 CORE-INTERFACE: interfaces to core IP-block debug data/control proprietary IO 2 BUS-INTERFACE: interface to a bus traffic [event/trace data collect, compression and triggering] 3 CROSS-TRIGGER INTERFACE: to other debug-IP blocks [event-synch.] 4 PIN-INTERFACE CONTROL: IF to JTAG for debug control to analyzer/debugger software. 5 PIN-INTERFACE DATA: interface for high speed data [like Nexus] Debug software API for information transfer and display: A. System Debug SW API interface B. EDA API interface – block and system level verification (ESL, RTL) CHIP Cross trigger IF 3 OCP Bus fabric Bus test socket 1 Core Debug IF Trace IF 2 Memory-mapped JTAG-mapped Nexus-mapped Debug-IP registers Debug IF 4 5 Nexus data-trace JTAG control Debug Software SYS API EDA API A B Debug Hardware Environment
3rd party CPUDebugger 3rd party DSPDebugger NEW OCP Debug Standard Basic OCP Debug Interface Standard Debug API (SPRINT) Extended OCP Debug Interfaces OCP Debug Compatible fabric B U S F A B R I C CPU Target Description IP-XACT, XML Access HW Debug HW HWIP Target Server DSP The SPRINT software standard is related to our work as a general debug functionality description for multiple processors.
Analysis tools JTAG TAP TDO TDI CrossTrigger Nexus TAP JTAG JTAG Bus Analyzer PM OCP DC Control Chain Compliant DC PM core DC Bus TAP Analysis Chain PM PM Arbitration Bus Fabric Other Cores Bus Master JTAG System Debug Instrumentation OCP Example • On-Chip Analysis • Bus Trace OCP analysis • Complex Cross-Triggering • Performance Monitoring (PM) • Debug Control (DC) • Bus Master Transactors • Integrated processor debug • OCP Debug Spec is in process of release
OCP Debug Standard Advantages Simplifies debug - Standardized Basic OCP core Debug Socket Facilitates Debug Hardware and debugging Software offered as standard IP Opens implementation and support of (heterogenious) processors Proprietary Debug solutions supported - Need just OCP Debug wrapper Fixed OCP debug interface, compatible to multitude of debug interconnects (I.e. Nexus, serial buses, cross bar, NoC, etc) High initial uptake of the new standard in the OCP-IP community
OCP Debug Information • OCP public white papers are at: www.ocpip.org/socket/whitepapers/ • OCP members get the standard at: www.ocpip.org/members/ocpspec/ • OCP membership admin: admin@ocpip.org • Non-members can access this standard using an on-line, click-through research License