Download
1 / 23
230 likes | 481 Views
TERM STRUCTURE OF INTEREST RATES (also called YIELD CURVE). A PLOT OF YIELD TO MATURITY VS. MATURITY. EXPECTATIONS THEORY OF TERM STRUCTURE. Y n = the nominal bond yield for a bond covering n years r n = the expected "forward" yield for a one year bond covering the one year period n .

E N D
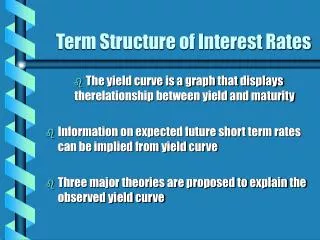
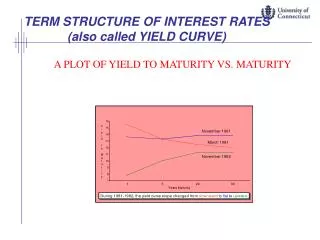
TERM STRUCTURE OF INTEREST RATES (also called YIELD CURVE) A PLOT OF YIELD TO MATURITY VS. MATURITY
EXPECTATIONS THEORY OF TERM STRUCTURE Yn= the nominal bond yield for a bond covering n years rn= the expected "forward" yield for a one year bond covering the one year period n. NOTE: r2 is not the two year bond yield, it is the yield that the market expects for the one year bond at the end of the current year. (1 + Yn)n = (1 + r1)(1 + r2)...(1 + rn) (1 + Yn) = [(1 + r1)(1 + r2)...(1 + rn)]1/n This implies that any nominal long bond yield can be expressed as a geometric average of one year yields.
QUESTION: Why must this hold? ANSWER: Because you always have the option of holding one year bonds and rolling them over. If this were not true then one could arbitrage, i.e., make a risk free return with no net investment. Look At Living Yield Curve – Smartmoney.com
EXAMPLE: Suppose that bond market participants expect the one year bond yields in each of the next 4 years will be the following: YEARONE YEAR YEILDS this year 8% one year from now 10% two years from now 11% three years from now 11% Derive the yield curve of one, two, three, and four year bonds from these one-year yields.
BOND MATURITYYIELD TO MATURITY one year 8% two years 9% three years 9.66% four years 10% NOTE: Each multi-year yield is an average of the single year yields covered by the bond maturity.
The formula for computing the one period forward yield beginning at time t is: for example, Note: The yield of a bond is also referred to as the current market interest rate or the “rate” on the bond.
Thus, you can back out the market expectations of various one period yields, (or any other multi-period forward yields). We take the ratio of the 10 year yield to the 10th power and the nine year yield to the 9th power and subtract 1 to get the one year yield expected for year ten. EXAMPLE 1: Suppose the yield on a 9 year bond is 8% and the yield on a 10 year bond is 9%. Find the one-year yield expected in year 10. EXAMPLE 2: Suppose the 3yr yield is 10% and the one year yield expected in two periods is 5%, what is the two year yield now?
(1 + Y3)3 = (1 + r1)(1 + r2)(1 + r3) since (1 + Y2)2 = (1 + r1)(1 + r2) (1 + Y3)3 = (1 + Y2)2(1 + r3) so, (1 + .1)3 = (1 + Y2)2(1 + .05) => (1 + Y2)2 = [(1 + .1)3/(1 + .05)] Y2 = [(1 + .1)3/(1 + .05)]1/2 - 1 = .126
QUESTION: How can one explain the different shaped yield curves? • Expectations of short yields are not constant • Liquidity Premium - longer bonds fluctuate more in • price - investors require risk premium. • Market segmentation - due to difference in • taxability, risk and maturity, coupons, etc.
DURATION • Duration is a better measure of bond risk than maturity • Duration considers both types of bond interest rate risk • Price risk - (really cash flow value risk) • Reinvestment risk - (zero coupon has no reinvestment risk - only “price” risk) • NOTE: Default risk is ignored here. • QUESTION: Why is reinvestment risk a risk at all? - for • pensions it is (maturity)
DURATION FORMULA = time weight x (discount cash flows)/(Bond Price) D = duration CFt = cash flow in time period t Y = yield to maturity per period T = maturity in periods - usually semi-annual B = bond price
A SHORTER WAY TO CALCULATE A COUPON BOND'S DURATION where T is the number of payments - for a thirty year bond with semi-annual coupons T = 60 c is the coupon rate per period - for a 12% coupon paid semi-annually, c = .06. Y is the yield to maturity per period - for a 9% yield with semi-annual coupons Y = .045
From this formula we can see that: • For zero coupon, Duration = Maturity • For Coupon bonds, Duration < Maturity because • Coupon bonds are like a series of zero coupon bonds • whose cash averaged duration = Bond duration • The larger the coupon, the smaller the duration • The longer the maturity, the larger the duration • (except for special cases) • The larger the yield to maturity, the smaller the • duration
EXAMPLE: 30 year treasury bond - 12% coupon (paid semi-annually) - 9% yield = 20.87 semi-annual periods or 10.44 annual periods
DURATION CAN BE USED TO ESTIMATE THE CHANGE IN A BOND'S PRICE IN RESPONSE TO A YIELD CHANGE Duration is the elasticity (from economics) of the bond price with respect to a yield change. For a bond paying semi-annual coupons: Yn = the new semi-annual yield Yo = the old semi-annual yield D = duration in semi-annual periods
EXAMPLE: 30 yr Treasury 12% coupon (paid semiannually) Duration = 20.87 semi-annual periods Old yield = 9% annual - New Yield = 8.5% annual = .05 = 5% QUESTION: Suppose two bonds are identical except that one pays annual coupons and the other pays semi-annual coupons. Do they have the same duration? If not, which is larger? - Annual
DURATION IS ONLY ACCURATE FOR SMALL CHANGES IN YIELDS Duration is an approximation for large changes in yields. Convexity is a measure of the error when yield changes are large (Always a positive number). Small Coupon / small Yield / long Maturity each implies larger convexity This means that long term zero coupon bonds with low yields have the most convexity and thus their predicted price change is more inaccurate.
PROBLEM: Lets check how good the % D P equation is for a zero coupon 30 year bond with Yo = 3% and Yn = .04 - assume annual periods. Estimated percent price change Its old price is Po = 1000/(1.03)30 = 412. Estimated new price, Pn = 412 * (1 - .29126) = 292 Its true new price will be Pn = 1000/(1.04)30 = 308.3 The error convexity is high for this bond
IMMUNIZATION - SET BOND PORTFOLIO DURATION EQUAL TO HOLDING PERIOD • Locks in yield, i.e., like holding zero coupon bond • Guarantees a specific percent return on investment • (and thus total dollar return) assuming one yield • change. • QUESTION: How can this be? • The two types of interest rate risk, price and reinvestment risk, offset: (1) when rates go up you lose on bond price but gain on reinvestment, (2) when the rates fall you gain on price but lose on reinvestment.
Go back to the idea that YTM assumes coupons are reinvested at YTM while actual rates may change over the bond's life - immunization is a hedge against the reinvestment rate changes. EXAMPLE: Show that your net dollar position is unchanged at the end of the holding period when interest rates change i.e., gain in price when rates fall offsets loss in reinvested coupon. Assume previous bond. 30 year Treasury 12% semi-annual coupon, 9% yield, duration = 20.87 = 21
Remember from previous lecture, Suppose yields fall to 8.5% immediately Price in 21 periods at 9% = Price in 21 periods at 8.5% = PRICE CHANGE = 1330.54 - 1273.47 = 57.07
For the following, use Cumulative value of reinvested coupons over 21 periods at 9% = Cumulative value of reinvested coupons over 21 periods at 8.5% = COUPON VALUE CHANGE = 1971.7 - 2026.99 = -55.3 The slight difference between the magnitude of the price change and the coupon change is due to the fact that I rounded duration to 21 periods and convexity.
HOW ELSE CAN DURATION BE USED? • Hedge portfolio in short term -estimate net portfolio • value changes • Banks have a duration mismatch called a "GAP" - • low duration liab. - med. to high duration assets. • Insurance companies have medium to high duration • assets and liabilities – they match durations. • QUESTION: Which will have more stable net worth • (Portfolio Value) - Insurance Cos.