Download
1 / 100
1.01k likes | 1.19k Views
FROM PERIL TO PROFIT WHAT DONORS SAY WILL TURN FUNDRAISING AROUND IN THIS ECONOMY. This Seminar Draws From…. Donor-Centered Fundraising Philanthropy in a Turbulent Economy Communication Is the Ask. How Profit Is Made in Fundraising. Not-for-Profits can only spend fundraising profit .

E N D
FROM PERIL TO PROFITWHAT DONORS SAY WILL TURN FUNDRAISING AROUND IN THIS ECONOMY
This Seminar Draws From… Donor-Centered Fundraising Philanthropy in a Turbulent Economy Communication Is the Ask
How Profit Is Made in Fundraising Not-for-Profits can only spend fundraising profit. Profit is the remainder between the value of the gift and the cost to get it The profit margin widens the longer a donor gives; therefore, extending donor retention equals earning higher profit a manageable number of donors, encouraged to stay loyal and inspired to give generously makes more money for a NFP than does a volume of donors which is so large that it has to be handled through mass marketing
How Fundraising Actually Works large-volume fundraising is the norm donor attrition is over 90%, with 65% of contributors never making a second gift constant, high volume acquisition is deployed to make up for the loss of large numbers of unprofitable or barely profitable donors this drains the fundraising budget, leaving too few resources for donor retention strategies
Why is the norm in fundraising actually the less profitable option? An Intriguing Question…
Changes in Giving: 2008 to 2009 • # donors contributing: down 5.8% (continuing a 3-year decline) • Donor Retention: down 1% (continuing a 5-year decline) • Donor acquisition: down 12.9% (3-year decline) • Reactivation of lapsed donors: down 6.5% (3-year decline) • Average gift value: down 2.1% (first time this has declined in 5 years of measuring) • 2009 Index of National Fundraising Performance; Target Analytics; performance of 35 million donors compared between 2008 and 2009
DONORS’ CHANGING GIVING BEHAVIOR 2002 TO 2007
How respondents’ giving philosophy has changed in the five years prior to economic decline
What inspires donor loyalty and increasing gift values? • prompt, meaningful gift acknowledgment • reassurance that gifts will be used for a specific end purpose • measurable results on the impact of donors’ contributions
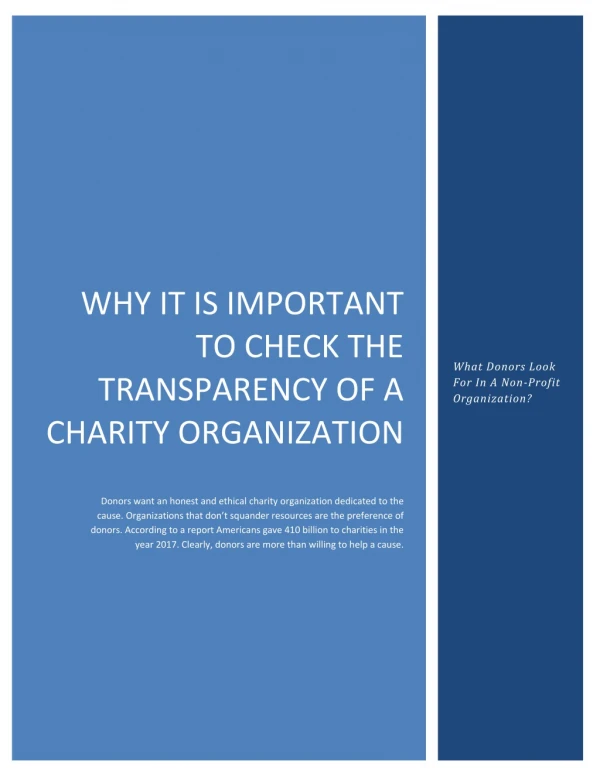
A March/09 review of NFP websites found that only 43% stated their mission & goals and only 4% identified how they use charitable donations Are Donors Noticing the Shift to a Donor-Centered Model?
Getting Donors and Keeping Donors – Not the Same Thing UNIQUE SELLING PROPOSITIONS FOR PROSPECTS AND DONORS
Why Donors Stop Giving(from Donor-Centered Fundraising, 2003) • 46% of study donors stop giving for reasons connected to a ‘failure to communicate’ • 41% stop giving because of over-solicitation
What Are Measurable Results? • progress that can be quantified – for instance, increase in volume of service or enhanced quality of programs • only specific programs and services can be measured
Why Are Measurable Results So Important to Donors? • they allow donors to evaluate whether their gifts are being used effectively • they justify donors’ assessment of themselves as contributing members of society
RESTRICTED vs UNRESTRICTED GIVING Case Study
How the Study, Philanthropy in a Turbulent Economy, Was Conducted • Online survey conducted between January 12 and February 3, 2009 • Cygnus reached out to 963,458 donors by partnering with 69 not-for-profits • 21,947 respondents started the survey; 17,365 answered all questions for a completion rate of 79.1%
Age 54.3% are between 45 and 64 years of age
Has Responsibility for Financially Supporting Children or Other Family Members
Volunteer positions held by the 68% of respondents with volunteer experience in last 12 months
Number of charitable causes supported in 2008 43.7% support 3-5 causes
Average Value of Gifts Made by Respondents in 2008 all respondents and top 5% by total giving
HOW THE ECONOMY HAS AFFECTED RESPONDENTS AND THEIR PHILANTHROPY
Short-term vs Long-term Expectations for Recovery • Respondents between 75 and 84 years of age are slightly more optimistic about the time it will take for the economy to recover • Respondents earning over $200,000 are somewhat more optimistic • Respondents who are more pessimistic about the timeframe for economic recovery gave, on average, 40% more money to charitable causes in 2008
Why some respondents will decrease charitable giving in 2009
Will the 24% of respondents committed to multi-year gifts alter their terms due to the economic downturn?
“But I Did Everything Right” Case Study
To what degree would the following scenarios motivate you to give to a not-for-profit organization? 1=not at all motivating 7=highly motivating
Double Gift Value 1=definitely would not 7=definitely would
How the economic slowdown will influence respondentsto alter their methods of giving in 2009 Respondents under 35 years of age
How the economic slowdown will influence respondentsto alter their methods of giving in 2009 Respondents 35 years of age and older