Download
1 / 1
10 likes | 151 Views
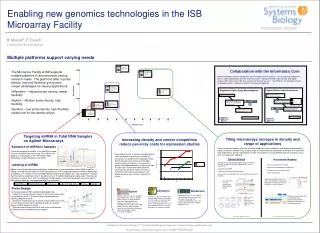
Total RNA . Dephosphorylate . Denature . Label with pCp-Cy3 . Purify . Hybridize. Enabling new genomics technologies in the ISB Microarray Facility. B. Marzolf 1 , P. Troisch 1. 1 Institute for Systems Biology. Multiple platforms support varying needs. Affymetrix Mouse/Human Exon.

E N D
Total RNA Dephosphorylate Denature Label with pCp-Cy3 Purify Hybridize Enabling new genomics technologies in the ISB Microarray Facility B. Marzolf1, P. Troisch1 1 Institute for Systems Biology Multiple platforms support varying needs AffymetrixMouse/HumanExon Collaboration with the Informatics Core 10M • The Microarray Facility at ISB supports multiple platforms to accommodate varying research needs. The platforms differ in probe density, cost and flexibility, giving each unique advantages for varying applications: • Affymetrix – Highest probe density, lowest flexibility • Agilent – Medium probe density, high flexibility • Spotted – Low probe density, high flexibility, lowest cost for low density arrays AffymetrixTiling New technologies require new tools for data management and analysis. Infrastructure development is done in close collaboration with the Informatics Core, making internally and externally developed analysis tools more accessible to a varied set of microarray users. GenePattern, a framework created by Broad Institute, is utilized in several of the analysis pipelines. 1M AffymetrixMouse/HumanGene ST Affymetrix Exon Array Normalization Agilent Multiple Scan Normalization Probe density AgilentTiling Raw intensity multi-scan intensity measurements Affymetrix raw CEL files 100K Combine scans to extend linear range with Masliner Bioconductor background subtraction, normalization, summarization AgilentMouse/Human4X AgilentMouse/HumanmicroRNA Choice of Bioconductor normalization methods Annotation with Synonym Web Service SpottedHalobacteriumexpression 10K Normalized data Annotated expression data 1 2 3 4 6 9 10 5 7 8 Relative Cost Targeting miRNA in Total RNA Samples on Agilent Microarrays Tiling microarrays increase in density and range of applications Increasing density and vendor competitionreduce per-array costs for expression studies Existence of miRNA in Samples Tiling microarrays typically utilize the maximum probe densities available on each platform to provide the highest resolution of probe tiling. Initially usage of tiling microarrays focused on chromatin IP on chip (chIP-chip) experiments, but has expanded to include transcriptome structure profiling and more specific assays such as nucleosome mapping. Check for presence of miRNAs in the total RNA sample using a small RNA Bioanalyzer chip. The miRNAs will produce a shallow peak in the 10nt to 40nt region, followed by a larger tRNA peak and rRNAs. Early improvements in microarray probe density were focused on increasing the number of transcripts that could be interrogated per array. Eventually, densities increased to the point where roughly every gene in a mammalian genome could be probed on a single array. Now that densities well exceed whole-genome coverage (for per-gene expression arrays), commercial microarray manufacturers are producing lower-cost, smaller surface area arrays. Transcriptome Nucleosome Mapping • RNA purification and labeling roughly follow conventional methods, except that specific subpopulations may be selected for: • polyadenylated RNA • negative selection for ribosomal RNA • preservation of small RNAs that may be lost by conventional methods Labeling of miRNA www.agilent.com • Cross-link nucleosomes to DNA • Digest linker DNA between nucleosomes • Purify out nucleosome-bound DNA • Label and hybridize Agilent uses a direct labeling method without amplification or size fractionation. A total RNA sample of 100ng is treated with calf intestinal alkaline phosphatase (CIP) to dephosphorylate the RNA in preparation for labeling. The sample is heat and DMSO denatured prior to the addition of a Cy3 fluorophore. A single Cy3 fluorophore is attached to the 3’ phosphate of a 3’, 5’-cytidine bisphosphate (pCp-Cy3). The pCp-Cy3 molecule is joined to the 3’ end of a miRNA by T4 RNA ligase. A mini chromatography column is used to desalt and remove any unincorporated pCp-Cy3 molecules. Aligning transcription start sites across all verified transcripts and plotting the average nucleosome occupancy reveals a pattern: RNA Raw intensities must be corrected for probe-specific effects ÷ genomic = Probe Design Affymetrix NimbleGen Agilent To increase probe-miRNA specific binding Agilent has – *Added a G residue (shown in black) to the 5’ end of each probe complimentary to the 3’ C residue (green) attached during labeling (diagram A and B) *Devised a 5’ hairpin structure (shown in blue) added to the end of each probe to eliminate the binding of large non-specific pieces of RNA (diagram A and B) *Reduced probe length from the 5’ end of the complimentary miRNA in order to destabilize certain probes NimbleGen arrays, as with Agilent, have multiple arrays per each slide, with up to 4 (and soon 12) separately hybridizable arrays. The 4-array slides allow up to 72,000 probes per array. Agilent synthesizes up to 8 separately hybridizable arrays of up to 15,000 probes each on a single microarray slide. New, lower-priced whole-genome mammalian arrays are available in 4 array slides, with 44,000 probes per array. Having multiple arrays on one slide allows the parallel processing multiple samples, increasing throughput. Plotting nucleosome positions and tiling data long chromosomes provides additional evidence for non-annotated transcripts Affymetrix synthesizes probes onto a quartz wafer that has a standard size. The wafer can then be sliced into anywhere from 49 to 400 arrays, depending upon the size of each individual array. Each array is packaged in a separate cartridge. Signal is plotted against the chromosome and segmented into regions of differing expression www.agilent.com David et al., PNAS, March 2006 Lee et al., Nature Genetics, September 2007 Institute for Systems Biology 7th Annual International Symposium, Systems Biology and Engineering We gratefully acknowledge support from NIGMS P50GMO76547