Download
1 / 13
130 likes | 536 Views
Chart. Creat a Chart. Steps to create a chart 1. Select the data range 2. Insert/Charts/Type 3. Use the Chart tool to add or modify chart elements: Design: Type, chart layout, style, move chart Layout: Insert, label, etc. Format Where to place the chart: As an embeded chart

E N D
Creat a Chart • Steps to create a chart • 1. Select the data range • 2. Insert/Charts/Type • 3. Use the Chart tool to add or modify chart elements: • Design: Type, chart layout, style, move chart • Layout: Insert, label, etc. • Format • Where to place the chart: • As an embeded chart • Or place it in a chart sheet • Chart tools/Design/Move chart
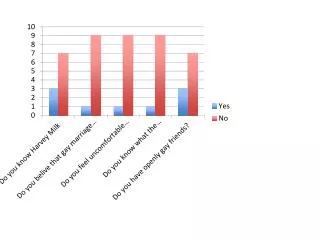
The Elements of a Chart 1. The chart : The entire chart; 2. The plot area; 3.The data points; 4. The horizontal (category) and vertical (value) axis; 5. The legend; 6. Chart and axis title; 7. Data label.
Column Chart Note: The data range for this column chart includes the labels of qtrs and years.
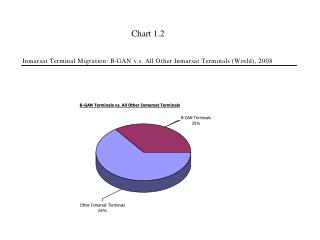
Pie Chart Note: The data range does not include the column headings.
Line Chart Note: 1: The data range includes the headings. 2. Right click the chart and choose Select Data to choose the Legend entries (series) and Horizontal axis labels correctly.
Combination Chart(more than one chart type) Example: Column chart for the Projected and Actual sales and Line chart for the Expenses. • Note: • Select the whole data range and create a column chart. • Click the expenses data series. Then click Chart tools/Design/Types and choose the line chart.
Chart a function • Y= X^2 • Data points: • X Y • 0 0 • 2 4 • 4 16 • 5 25 • Add another function: Y = X ^ 3
Charting a Break-Even Point • Total revenue = 2*Q • Total cost = (100,000 + 50,000) + Q • Notes: • Choosing the X-axis points properly • How to make the line to cross the 0 point? • Select category axis: • Chart Tools/Format/Select Chart Area/Horizontal axis/Format selection) • Or move the mouse to the horizontal (category) axis, right click and select Format selection • Check On tick marks for the Position Axis property. • Adding textbox and other drawings: • Chart tools/Layout /Insert
Charting Decision Rules • An Internet Service Provider charges customers based on hours used: • First 10 hours $15 • Each of the next 20 hours $2 per hour • Hours over 30 hours $1 per hour
Comparing Decision Rules • Plan 2: • First 20 hours: $20 • Hours over 20 $1.5 • Plan 3: • $35 unlimited access.
Charting Functions • Demand function: • P = 150 – 6*Q^2 • Supply function: • P = 10* Q^2 + 2*Q • Note: • Positive area • Value axis maximum/minimum value: • Format Value Axis
Downloading Stock Histocal Prices From Internet • Yahoo: • Finance/Enter Symbol(or lookup symbol)/Historical prices/Set Date Range/Download to Spreadsheet