Download
1 / 53
550 likes | 843 Views
Regularized Double Nearest Neighbor Feature Extraction for Hyperspectral Image Classification. Hsiao-Yun Huang Department of Statistics and Information Science, Fu-Jen University. Hyperspectral Image Introduction 1. (image credit: AFRL). Hyperspectral Image Introduction 2.

E N D
Regularized Double Nearest Neighbor Feature Extraction for Hyperspectral Image Classification Hsiao-Yun Huang Department of Statistics and Information Science, Fu-Jen University
Hyperspectral Image Introduction 1 (image credit: AFRL)
Hyperspectral Image Introduction 2 (image credit: AFRL)
Applications of Hyperspectral Image • Military: military equipment detection. • Commercial: mineral exploration, agriculture and forest production. • Ecology: chlorophyll, leaf water, cellulose, lignin. • Agriculture: illness or type of the plants.
Classification of Hypectral Image Pixels • How to distinguish different land cover types precisely and automatically in the hyperspectral images is an interesting and important research problem. • Generally, each pixel in a hyperspectral image is consisted of about hounds or even thousands of bands. This makes the discrimination among pixels a high-dimensional classification problem.
High-Dimensional Data Analysis • “We can say with complete confidence that in the coming century, high-dimensional data analysis will be a very significant activity, and completely new methods of high-dimensional data analysis will be developed;…” • (Lecture on August 8, to the American Mathematical Society ‘Math Challenges of the 21st Centure’ by David L. Donoho (2000))
x3 x2 x3 x3 0.35 0.35 0.35 x1 x2 x3 0.3 0.3 0.3 0.25 0.25 0.25 0.2 0.2 0.2 x1 x1 x2 0.15 0.15 0.15 x2 x1 0.1 0.1 0.1 0.05 0.05 0.05 0 0 0 -5 0 5 10 -5 0 5 10 -5 0 5 10 Blessing: The Power of Increasing Dimensionality
The Curse of Dimensionality • In statistics, it is about the situation that the convergence of any estimator to the true value of a smooth function defined on a space of high dimension is very slow. That is, we need an extremely large amount of observations. • (Bellman, 1961 ) • http://www.stat.ucla.edu/~sabatti/statarray/textr/node5.html
The Challenge • Unfortunately, in hyperspectral image classification, the p > N case is the usual situation due to the access of training samples (ground truth data) can be very difficult and expensive. • The large dimension but few samples problems might cause the accuracy rate of the hyperspectral image classification to be unsatisfied.
Dimensionality Reduction • One common way to deal with the curse of dimensionality is to reduce the number of dimensions. • Two major reduction ideas: • Feature Selection • Feature Extraction
x1 f1 f2 xp x1 f1 f2 xp • Feature selection:select lout of p measurements • Feature extraction:map p measurements to l measurements
150 Selection 6 100 4 50 2 0 0 -5 0 5 Extraction 150 -2 -4 100 -6 50 5 0 -5 0 -5 0 5 Feature Extraction v.s. Feature Selection
Basic Ideas of Feature Extraction • Feature extraction consists of choosing those features which are most effective for preserving class separability. • Class Separability depends not only on the class distributions but also on the classifier to be used. • We seek the minimum feature set with reference to the Bayes classifier; this will result in the minimum error for the given distributions. Therefore, the Bayes error is the optimum measure of feature effectiveness.
One Consideration • A major disadvantage of the Bayes error as a criterion is that an explicit mathematical expression is not available except for a very few special cases, therefore, we cannot expect a great deal of theoretical development.
Practical Alternatives • Two types of criteria which have explicit mathematical expressions and frequently be used in practice: • Functions of scatter matrices (do not relate to the Bayes error) • Conceptually simple and give systematic algorithms. • Bhattacharyya distance type of criteria (give upper bounds of the Bayes error) • Only for two-class problem, and based on normality assumption.
Discriminant Analysis Feature Extraction (DAFE or Fisher’s LDA) Sb in pairwise structure Is the number of class Note: The number of extracted features are min{p,L-1} where p is the dimension of the mean vector
DAFE v.s. PCA PCA DAFE
Drawbacks of the Fisher’s LDA (1) • In some situations, is not a good measure of class separability • Share the same mean: No scatter of M1 and M2 around M0 • Multimodal: more than L-1 features are needed Unimodal share the same mean Multimodal and share the same mean Multimodal
_: true eigenvalues • - : Sw eigenvalues Eigenvalue (dim/n=10) 0 dim Drawbacks of the Fisher’s LDA (2) • The unbiased estimate S (pooled covariance estimate) of the within-class scatter matrix is adopted in LDA. If it is singular, the performance will be poor. • When dim>>n, S will loose its full rank as a growing number of eigenvalues become zero. So, it is not positive definite and can not be inverted. 100
Feature Extraction Methods with Other Measure of Separability • Nonparametric Discriminant Analysis (NDA; Fukunaga and Mantock, 1983). • Nonparametric Weighted Feature Extraction (NWFE; Bor-Chen Kuo and Landgrebe, 2004) • Regularized Double Nearest Proportion Feature Extraction (RDNP; Hsiao-Yun Huang and Bor-Chen Kuo, submitted)
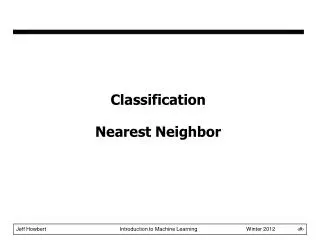
The idea of Nonpaprametric Discriminant Analysis (NDA; Fukunaga and Mantock,1983) Try to separate the boundary Instead of separating the means like LDA
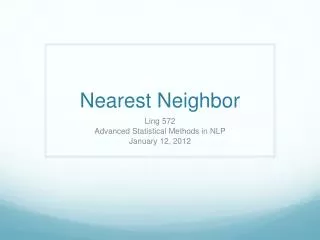
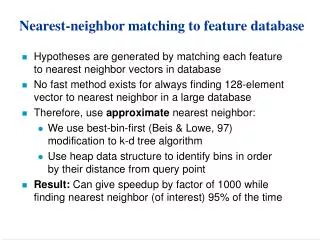
Nearest Neighbor Structure k NN for class j Xik k NN for class i
Pairwise Between-Class Scatter Matrix Large weight Xik Xih Small weight
The Properties of NDA • The between-class scatter matrix Sb is usually full rank. So, the restriction about only min(#class-1, dim) features can be extracted can be liberated. • Since the parametric nature of the Sb is replaced by the nonparametric Sb which leads to preserve important boundary information for classification, NDA is more robust.
Some Considerations about NDA When Overlap Occurs (1) • Based on the definition of the boundary of NDA (the focus portion of the distribution), the points with similar distance among the considered two groups are regarded as the boundary points. • This definition of boundary will fail when overlap occurs, because the points around and within overlap region will tend to have the same weight.
+ + + + + + ( i ) x l + + + + + + Projection direction Projection direction ? ? Then Boundary of NDA When Overlap Occurs
Some Considerations about NDA When Overlap Occurs (2) • In NDA, the kNN is adopted for measuring the ‘local’ between-class scatter, so the selected k is a very small integer as kNN people usually do (All the experiments in the paper and book shown by Fukunaga use either k=1 or 3). • This setting of k might cause the data point j and its local mean are very similar (close). The consequence is that the entries of Sbj will be very close to zero and thus cancels out the effect of the weight or makes the Sbj even with less influence among the overall Sb.
Some Considerations about NDA When Overlap Occurs (3) • Also, in the Sb of NDA only one data point is used to represent one group and used the kNN mean to represent the other local group. This makes the Sb may not measure the scatter between “groups” very well and be easily influenced by the outliers.
One Another Consideration • In the NDA, the boundary is estimated based on the sample. Even when the sample distributions are not overlapped, based on the setting of NDA, the estimated boundary might be too close to the edge (since small k and only one xj in one group is used in Sb). • Like what happened in the hard SVM, extremely clear cut support vectors (boundary) estimated from the sample might have unsatisfied performance due to the over fitting.
The Singularity Problem • In NDA, the unbiased covariance estimate S is still adopted ,thus, the singularity problem still exist in NDA.
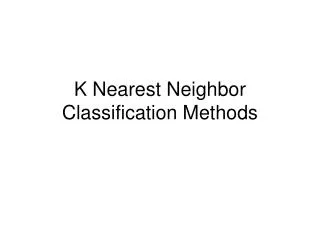
Nonparamentric Weighted Feature Extraction (NWFE) Large Weight Light Weight
Nonparametric Weighted Feature Extraction (NWFE; Kuo & Landgrebe, 2002, 2004)
Double Nearest Proportion Structure Class j other-class nearest proportion * Class i * Weight reference self-class nearest proportion
Robust Against the Overlap Class j larger weight * * + + Class i smaller weight
The Improvement of the Estimation of Sw (1) • In Regularized Discriminant Analysis (RDA) (Friedman, 1989), an extension of LDA, also proposed a improvement version of the Sw in LDA. The generalized version of that estimate is ∑ˆ= λ ∑ˆ +(1- λ) (σˆ)^2 I λ is between 0 and 1. The question is how to choose λ? (Friedman suggested using cross-validation.)
The Improvement of the Estimation of Sw (2) • In NWFE, different way to get the local mean and weight in NDA were proposed. But, the most influential effect on the performance improvement is its proposed estimation of Sw • Why 0.5?
The Shrinkage Estimation of Sw • Let Ψ denote the parameters of the unrestricted high-dimensional model, and Θ the matching parameters of a lower dimension restricted submodel. Also, let U be the estimate of Ψ and T be estimate of Θ. Then the shrinkage (regularized) estimate U* = λ T +(1-λ )U where λ is between 0 and 1. • λ can be determined analytically by Ledoit and Wolf lemma (2003). Once the T (target) is specified, the λ can be calculated.
Some Targets • J. Schafer and K. Strimmer (2005) proposed six targets for the shrinkage estimate of the Sw.
RDNP Feature Extraction • The feature transformation matrix of RDPN is composed of the eignvectors of where ,
The Properties of RDNP (1) • RDNP is more likely to figure out the boundary when overlap occurs. • Use proportion mean in each group, so the between groups scatter could be measured more properly, the entries of the Sb will not be so close zero, the influence of the outliers will be reduced, and the estimated boundary will not too close to the edge.
The Properties of RDNP (2) • When NPi=Ni and NPj=Nj, then it can be easily shown that the features extracted by the RDNP is exactly the same as the features extracted by the Fisher’s LDA. Thas is, LDA is a special case of RDNP.
Experiment Result 1(Washington DC Mall , Classifier: 1nn, Features 6)
Experiment Result 2(Washington DC Mall , Classifier: SVM, Features 6)
A color IR image of a portion of the DC data set NWFE with 1nn 1NN-NS (191 bands) RDA with 1nn RDNP with 1nn
Experiment Result 3(Indian Pine Site, Classifier: 1nn, Features 8)
Experiment Result 4(Indian Pine Site, Classifier: SVM, Features 8)