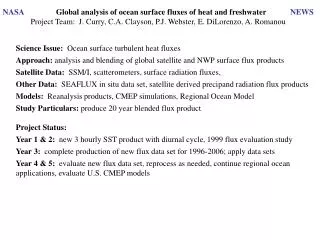
Ocean Heat Uptake
150 likes | 344 Views
What is the global heat reservoir for climate? – The Ocean! How much heating has gone where on Earth? What is the upper ocean heating since 1993? How are the data taken? How much data are available? What about the deep ocean? How important AABW vs. NADW ventilation?

Ocean Heat Uptake
E N D
Presentation Transcript
What is the global heat reservoir for climate? – The Ocean! • How much heating has gone where on Earth? • What is the upper ocean heating since 1993? • How are the data taken? • How much data are available? • What about the deep ocean? • How important AABW vs. NADW ventilation? • What is the AABW warming over 1990s–2000s? • Feedback, forcing, transient? (Q = T + F ) • What is a petawatt or a zetajoule? • What are the consequences for climate projections? • What are the different time-scales? Ocean Heat Uptake Gregory C. Johnson1,2, John M. Lyman3,1, & Sarah G. Purkey2,1 1NOAA/Pacific Marine Environmental Laboratory, 2University of Washington School of Oceanography, 3JIMAR University of Hawaii
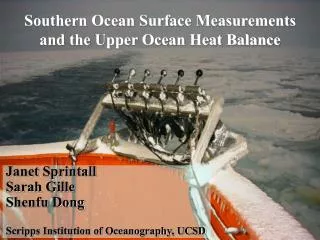
Sun 342 W/m2 342 W/m2 Incoming heat Outgoing heat Top of atmosphere ~0.24 W/m2 Net heat input to Earth’s climate system 1961-2003: Oceans Take up 89% of Heat Absorbed by Earth (from IPPC AR4, Figure 5.4) Total is 159 Zeta-Joules (or 0.24 W/m2 applied over the entire surface area of the Earth over that entire time period) Note: Ocean rate from 1993–2009 estimated at 0.74 W/m2
Upper Ocean Heat Content (1993–2008)(Lyman et al. 2010 – Nature) Error Budget uses curves from numerous investigators
DiverseDataSources Conductivity, Temperature, Depth (CTD) Reversing Therm. (courtesy SIO) MBT not shown XBT (left) & Argo Float (right) Subsurface Mooring (courtesy TAO/PMEL)
Three Different Sampling Eras • 2004–Present (Argo) • Near-global (90%) coverage to 2 km • year-round sampling • High quality data • 1967–2003 (XBT) • About 70% coverage to 700 m • Not much winter data • Lacks S. Ocean data (shipping lanes) • XBT Instrument Biases • Good CTD & reversing therm data • Pre-1967 (Reversing therm & MBT) • About 30% coverage to 300 m • MBT instrument biases • Reversing therm. data good quality
AABW Dominates the Abyss (Johnson 2008) • NADW prominent in • W. Atlantic • Mid-depth ACC • AABW dominates elsewhere Atlantic Pacific AABW NADW
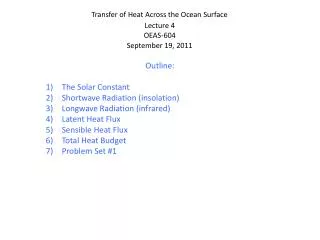
Brazil Western S Atlantic Warms 2005 – 1989(Johnson and Doney, 2006) • AABW Warming: • S. Ocean mid-depth • Abyssal northward • Mean 0.04C warming • 16-year time interval
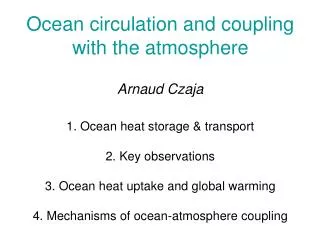
Abyssal & Deep Heat Content Changes(Purkey & Johnson, in press, J. Climate) • Local decadal heat content changes (W m-2) for z > 4000 m • The closer to AABW sources, the larger the heat gain. • 9 of 17 warming basins significantly different from zero at 95% • 1 of 7 cooling basins significantly different from zero at 95% • S. Ocean for 1 > z > 4 km (magenta line & #s) also warms
Heating rates with 95% CI • Expressed as contribution to global surface fluxes per unit depth • Vertical integrals for tabulation • S Ocean Deep warming • Z > 1000 m statistically significant • Global Abyssal warming • Statistically significant z > 3000 m • Hypsometry important • Sum ~1/8th of total ocean uptake • Note: Only 28 sections -> large errors Global Abyssal & Deep S. Ocean Changes(Purkey & Johnson, in press, J. Climate)
What is a PetaWatt or a ZetaJoule? • TOA flux entering the oceans in 1990s – 2000s is ~0.74 W/m2 • Global ocean heat uptake ~0.38 PetaWatts of power: • ~25 times humankind’s 2008 rate of energy use • ~7 Hiroshima Bombs per second • ~45 1200-watt hair dryers running continuously for each of the 6.86 billion people on earth • One decade of ocean heat uptake ~119 ZetaJoules of energy: • Causes ~1.35 cm of thermosteric sea level rise • Energy sufficient to melt land ice to raise sea level by ~1 m • Energy sufficient to warm upper 50 m of world ocean by ~1.6°C • Ocean has ~1000 times atmosphere’s heat capacity • Energy sufficient to warm the atmosphere by ~23°C
Freshwater Hosing Experiment – continuous surface input • Atlantic Overturning Streamfunction • Control shows NADW cell • Also strong AABW cell: • S. Ocean freshening shuts it down • Global S. Ocean & deep ocean warm • IPCC AR4 models show similar patterns (Gupta et al., 2009) • Getting all the ocean warming & causes requires observations and study of all depths including the S. Ocean Climate Change Models: AABW Warming(Stouffer et al. 2007)
Ocean Heat Uptake and Climate Sensitivity (Raper et al. 2002) Q = T + F Radiative Forcing (Q) change partitioned between increased heat loss to space (T) and uptake of heat by the ocean (F) where T is the global average tropospheric temperature change and is a climate feedback factor Largest climate sensitivity model takes up the most ocean heat (and the most heat deep in the ocean). What is going on in the ocean depths is important for climate. Also important for sea level rise.
The Oceans & Climate (Meehl et al. 2005) • Different CO2 concentration scenarios • CCSM3 (solid-higher sensitivity) • PCM (dashed-lower sensitivity) • Different sensitivities -> different surface temps • Some indications that ocean heat uptake (including deep ocean) related to climate sensitivity • Deep overturning difficult to model • Deep temperature drift in models too • Global air temperature equilibrates within decades of CO2 stabilization: Upper ocean temperature adjustment important • Sea level rises for centuries after stabilization: Large heat capacity and long ventilation time-scale of the deep ocean important (ice melt too)
Ocean is taking up most of the global warming heat at present • primarily in the upper ocean • deep ocean ~1/8th of net ocean • Deep warming widespread • Largest near Antarctica • Smaller distant from S. Ocean • Upper ocean temperature record has • Instrument biases (XBT, MBT) • Sparse historical sampling • Deep ocean temperature record has • Very high-quality measurements since 1980’s • But very sparse sampling • Ocean warming (1990s-2000s: 0.74 ± 0.13 W/m2, less when including earlier times) & its vertical distribution important for: • Quantifying global energy imbalance • Transient response (commitment) and climate sensitivity • Sea level rise contribution Conclusions