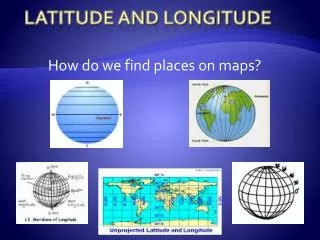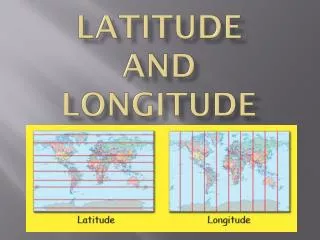
Longitude and Latitude Maps
140 likes | 396 Views
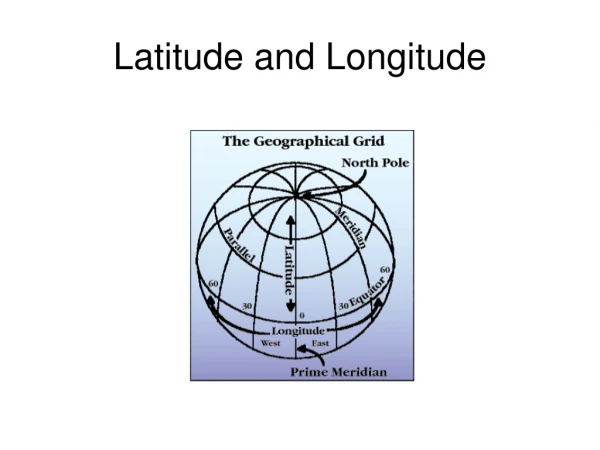
Longitude and Latitude Maps. Pre Calculus Project to Introduce Intellectual Need for Sinusoidal Modeling. Why do we have seasons?. Click to see Animation. http://www.mathsisfun.com/earth-orbit.html. Daylight Hours in Mill Valley. USA. Antarctica.

Longitude and Latitude Maps
E N D
Presentation Transcript
Longitude and Latitude Maps Pre Calculus Project to Introduce Intellectual Need for Sinusoidal Modeling
Why do we have seasons? Click to see Animation http://www.mathsisfun.com/earth-orbit.html
Assignment: As a class, model the hours of sunlight on our planet, as it changes over the year. • Two factors contribute to number of hours of daylight: • Latitude of the location on Earth • Day of the Year • Individual classmates choose latitudes such that the class as a whole will get data that models the hours of daylight over a year, on a variety of spots on earth. Each student will model for a latitude in increments of 5 degrees from -90 to 90 • Each student with a given latitude will find a town, site, relevant location that has approximately that latitude then will download (from the link below) a table of the hours of daylight for each day of the year for that particular location (latitude) http://aa.usno.navy.mil/data/docs/Dur_OneYear.php • Each student will create a graph by hand (on THIS grid) that models that data. This skill of “modeling sinusoidal functions” is the explicit skill for Pre Calculus (instructions on page 423 of textbook). Although desmos.com or a Ti graphing calculator are both good tools to verify your graph, you MUST show calculations and steps that help you build the graph by hand. • Then graph your equation using the Desmos graphing calculator. Set windows x: (-1,13) y: (-1,25) • When all teams have produced their models, by creating a Gallery Walk in our class, we can see the impact of latitude on Hours of Daylight.
Critical Values for the GraphModeling Data using Sine Curves Find B ( Amplitude: Period: Phase Shift (Horizontal Shift) of your starting point: End of 1 full cycle (period). Divide region between starting point and ending point into 4 even sections. Mark max, zero, min.
Graph of Daylight Hours Hours of Sunlight 1/21 2/21 3/21 4/21 5/21 6/21 7/21 8/21 9/21 10/21 11/21 12/21 Months of the Year (Use the data from the 21st of each month)
How can it be modeled? http://astro.unl.edu/classaction/animations/coordsmotion/daylighthoursexplorer.html Click to see Animation