Download
1 / 7
70 likes | 210 Views
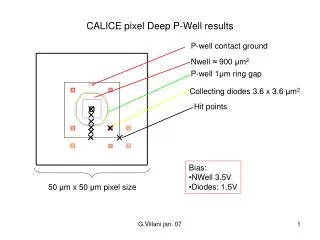
Cell 7. Cell 8. Cell 9. Cell 4. Cell 5. Cell 6. 3. 4. Cell 2. Cell 3. 1. 2. CALICE D4 simulation results G.Villani nov. 05. Cell size: 25 x 25 m 2. Epitaxial thickness: 20 m. Diode location: S4. 1. Diode size: 1.5 x 1.5 m 2. 10. Each cell consists of 4 diodes the

E N D
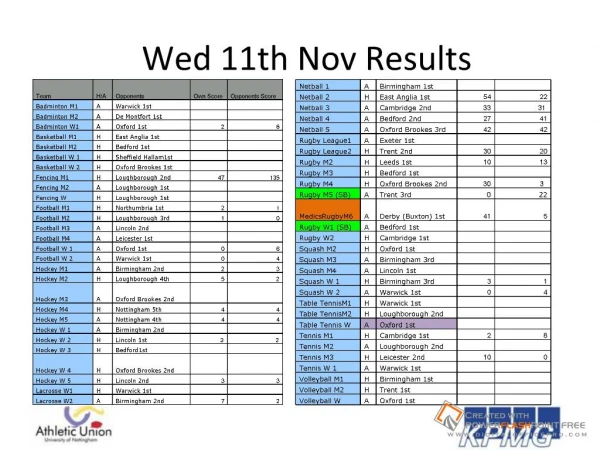
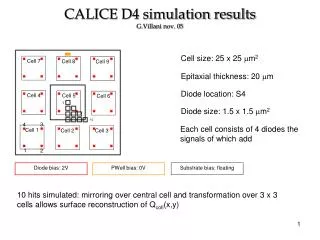
Cell 7 Cell 8 Cell 9 Cell 4 Cell 5 Cell 6 3 4 Cell 2 Cell 3 1 2 CALICE D4 simulation resultsG.Villani nov. 05 Cell size: 25 x 25 m2 Epitaxial thickness: 20 m Diode location: S4 1 Diode size: 1.5 x 1.5 m2 10 Each cell consists of 4 diodes the signals of which add Cell 1 Diode bias: 2V PWell bias: 0V Substrate bias: floating 10 hits simulated: mirroring over central cell and transformation over 3 x 3 cells allows surface reconstruction of Qcoll(x,y)
CALICE D4 simulation resultsG.Villani nov. 05 Individually collected charge e- hit 1 Cell (Σ diodes) collected charge e- hit 1
CALICE D4 simulation resultsG.Villani nov. 05 e- Surface Qcoll(x,y) sampled along (x, x) and (x, 37.5) Surface Qcoll(x,y) Cell boundaries Normalized surface Qcoll(x,y) sampled along (x, x) and (x, 37.5) Normalized surface Qcoll(x,y) vs. max(Qcoll(x,y))
CALICE D4 simulation resultsG.Villani nov. 05 Normalized surface Qcoll(x,y)
CALICE D4 simulation resultsG.Villani nov. 05 20% 40% 60% 80% Contour plot of cell charge at different % of total collected charge Normalized surface Qcoll(x,y) vs. max(Qcoll(x,y)) Increasing number of threshold levels reduces spatial error Minimum error around ≈ 57 % ( need further analysis)
CALICE D4 simulation resultsG.Villani nov. 05 • Maximum signal around 420 e- when Σ • Effect of spread of charge can be limited by increasing number of levels threshold or reducing thickness of epitaxial layer Conclusions
ADDENDACALICE D4 simulation resultsG.Villani nov. 05 Starting from the simulation data corresponding to the hits of figure 1, a triangular matrix of hits is built: For example, the effect of hit (6,1), highlighted in yellowish, on central cell is assumed to be the same of hit (8,1), highlighted in cyan, on cell 2 (cells are numbered as in figure 1). This transformation is accomplished by applying a symmetry matricial transformation to each hit until a triangular matrix is obtained. A mirroring over the full 3 x 3 cells finally gives the hits array (19 x 19 sampling points, ≈ 4.16 μm virtual cell size) • As a consistency check, two simulation were run at locations (10.5,10.5) and (10.5,37.5) • to verify goodness of the method. Predicted results of normalized collected charge differed from simulations • of 2% and 0.5% respectively.