Download
1 / 29
290 likes | 402 Views
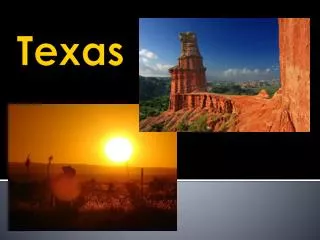
Regional background ozone in Texas: Recent research and future needs. Mark Estes a , Shaena Berlin b , Andrew Langford c , Melody Dong d , Jim Smith a , Fernando Mercado a , David Parrish c Presented to AQAST Meeting, Rice University January 16, 2014.

E N D
Regional background ozone in Texas: Recent research and future needs Mark Estesa, Shaena Berlinb, Andrew Langfordc, Melody Dongd, Jim Smitha, Fernando Mercadoa, David Parrishc Presented to AQAST Meeting, Rice University January 16, 2014 Texas Commission on Environmental Quality, Austin, TX Massachusetts Institute of Technology, Cambridge, MA NOAA ESRL Chemical Sciences Division, Boulder, CO Dept. of Bioengineering, University of California, San Diego Air Quality Division
Introduction • Measured background ozone trend on US west coast is upward; linked to increasing Asian emissions (Jacob et al. 1999; Jaffe et al. 1999, 2003; Cooper et al. 2010, 2012; Parrish et al. 2009; Reidmiller 2009; Brown-Steiner and Hess 2011; Lin et al. 2012; Zhang et al. 2008, 2011; Widger et al. 2013; Pfister et al. 2013) • Question: What is the regional background ozone trend in HGB and DFW? What factors affect background ozone in the eastern half of Texas?
Outline • Two methods for estimating background ozone in Houston, PCA and upwind-downwind: Berlin, S., A. Langford, M. Estes, M. Dong, and D. Parrish (2013), Magnitude, decadal changes and impact of regional background ozone transported into the greater Houston, Texas area, Environ. Sci. Technol., 2013, 47 (24), pp 13985–13992, DOI:10.1021/es4037644 • Seasonal variations in background ozone • Transport effects upon background ozone • Trends in regional background ozone • Both Houston-Galveston and Dallas-Fort Worth
Definition of regional background ozone • For these analyses, regional background ozone is the ozone transported into the area such that local emissions have little influence upon the ozone concentrations. • Generally not equivalent to “natural background” or “policy-relevant background.”
Sites outside the red boundary are able to measure background ozone reliably; sites inside often do not, due to influence from local sources.
Estimated HGB background ozone for every day from April 1, 2000 to October 31, 2012 Median background ozone: 30 ppbv Mean: 32.6 ppbv 95th percentile: 58 ppbv Clearly, there are systematic variations in background ozone during the ozone season.
Peak and background ozone are correlated, though correlation is not causation. Conditions suitable for high background are also suitable for high local production (i.e., clear skies, light winds, high temperatures).
Background ozone drops during mid-summer due to transport from the Gulf (Davis et al. 1998; Chan and Vet, 2010; Smith et al. 2013).
Highest concentrations linked to continental flow Intermediate concentrations linked to coastal flow Lowest concentrations linked to Gulf of Mexico flow
95thbackground: -0.58 ± 0.19 ppbv/yr (p = 0.011) 50th background: -0.071 ± 0.25 ppbv/yr (p = 0.78) Flat or downward trend consistent with Cooper (2012), Oltmans (2012), Parrish (2012), and Lefohn (2010, 2013).
Estimated DFW background ozone for every day from April 1, 2001 to October 31, 2012 DFW Median background ozone: 41 ppbv Mean: 41.3 ppbv 95th percentile: 63 ppbv HGB Median background ozone: 30 ppbv Mean: 32.6 ppbv 95th percentile: 58 ppbv
Mean background is almost constant during ozone season; mean local contribution peaks in early August
Flow from DFW gives high ozone. Flow from E and NE gives high ozone, like HGB, but with somewhat different source regions. Flow from south gives lower ozone, but not as low as HGB.
Slope of annual median concentration is not significant (p = 0.39); slope of annual 95th percentile concentration is significant (p = 0.038).
Conclusions • Regional background ozone concentration trends are flat or decreasing in both HGB and DFW. The increase observed on the US west coast due to Asian emissions is not apparent in eastern Texas. • In both cities, background ozone varies with transport pattern, especially in Houston. In Houston, background ozone trends vary with transport direction, with flow from the Gulf of Mexico having zero trend, and flow from continental US having a downward trend (Berlin et al. 2013). • Regional background ozone in DFW is on average higher than in HGB. • Peak daily 8-hour ozone concentrations in Houston and DFW are positively correlated with regional background ozone. • In Houston, background and local ozone vary with season; highest total ozone tends to occur when both peak. In DFW, background ozone is nearly constant; local contribution and total ozone peak in early August. • Analyses imply that much of the seasonal ozone variation is contributed by large-scale spatial and temporal patterns.
Future needs • This analysis focuses upon averages, not case studies or exceptional events. Studies of days with high regional background ozone and/or high local ozone production would be useful. • Quantifying sources of regional background ozone: within Texas, within US, outside US, natural and anthropogenic. Quantifying the effects of changes in precursor emissions. Quantifying the effects of different meteorological patterns. • Improved modeling of regional background ozone, both over ocean and over land—in general, models are overpredictingbackground ozone.
Contact information • Mark.Estes@tceq.texas.gov • (512) 239-6049
Method details: Background ozone estimation at upwind sites • Select sites in the Houston area that are capable of measuring background ozone, given the proper conditions. These sites are not located near large emission sources • Calculate peak daily 8-hour ozone for each site. • Select the minimum peak daily 8-hour ozone from the subset of background sites. • Ozone season defined as April 1 – Oct 31. • Number of sites selected varied from 6 to 19, greatly increasing after 2002.
85 ppbv NAAQS 75 ppbv NAAQS *2013 DV not finalized
95th MDA8: -2.33 ± 0.40 ppbv/yr, p = 0.00012 50th MDA8: -0.64 ± 0.33 ppbv/yr, p = 0.077
95th local: -1.76 ± 0.26 ppbv/yr, p = 0.000029 50th local: -0.60 ± 0.18 ppbv/yr, p = 0.0062
(a) Trends in the highest MDA8 O3 reported by one of the 6 CAMS stations used in the PCA analysis (Max 6 CAMS) and by all HGB CAMS (Max HGB). The number of ozone exceedance days (2008 NAAQS) at the 6 CAMS stations is also shown. (b) and (c) Trends in mean MDA8 ozone and background and local contributions from the 6-station PCA and the TCEQ methods, respectively. The solid lines indicate the linear least-squares fits; the parameters of the fits with 95% confidence intervals are annotated.
Slope of annual median peak ozone is not significant (p = 0.57); slope of annual 95th percentile peak ozone is significant (p = 0.0062), as is the slope of annual maximum peak ozone (p = 0.0054).
References • Brown-Steiner, B., and P. Hess (2011), Asian influence on surface ozone in the United States: A comparison of chemistry, seasonality, and transport mechanisms, J. Geophys. Res., 116, D17309, doi:10.1029/2011JD015846. • Chan, E., and R. J. Vet (2010), Baseline levels and trends of ground level ozone in Canada and the United States, Atmos. Chem. Phys., 10, 8629–8647, doi:10.5194/acp-10-8629-2010. • Cooper, O. R., R.-S. Gao, D. Tarasick, T. Leblanc, and C. Sweeney (2012), Long-term ozone trends at rural ozone monitoring sites across the United States, 1990–2010, J. Geophys. Res., 117, D22307, doi:10.1029/2012JD018261. • Cooper, O.R. et al. (2010), Increasing springtime ozone mixing ratios in the free troposphere over western North America, Nature, 463, doi:10.1038/nature08708. • Davis et al. (1998), Modeling the effects of meteorology on ozone in Houston using cluster analysis and generalized additive models, Atmos. Environ., 32(14-15):2505-2520. • Fiore, A., D. J. Jacob, H. Liu, R. M. Yantosca, T. D. Fairlie, and Q. Li, (2003), Variability in surface ozone background over the United States: Implications for air quality policy, J. Geophys. Res., 108(D24), 4787, doi:10.1029/2003JD003855. • Hudman, R. C., et al. (2004), Ozone production in transpacific Asian pollution plumes and implications for ozone air quality in California, J. Geophys. Res., 109, D23S10, doi:10.1029/2004JD004974. • Jacob et al. (1999). Effect of rising Asian emissions on surface ozone in the United States. Geophys. Res. Lett., 26(14): 2175-2178. • Jaffe et al. (1999). Transport of Asian air pollution to North America. Geophys. Res. Lett. 26(6): 711-714.
References • Jaffe et al. (2003). Increasing background ozone in the spring on the west coast of North America. Geophys. Res. Lett. 30 (12): 1613, doi:10.1029/2003GL017024. • Kemball-Cook, S., D. Parrish, T. Ryerson, U. Nopmongcol, J. Johnson, E. Tai, and G. Yarwood (2009), Contributions of regional transport and local sources to ozone exceedances in Houston and Dallas: Comparison of results from a photochemical grid model to aircraft and surface measurements, J. Geophys. Res., 114, D00F02, doi:10.1029/2008JD010248. • Langford, A. O., C. J. Senff, R. M. Banta, R. M. Hardesty, R. J. Alvarez II, S. P. Sandberg, and L. S. Darby (2009), Regional and local background ozone in Houston during Texas Air Quality Study 2006, J. Geophys. Res., 114, D00F12, doi:10.1029/2008JD011687. • Lefohn, A.S., Emery, C., Shadwick, D., Wernli, H., Jung, J., Oltmans, S.J., Estimates of Background Surface Ozone Concentrations in the United States Based on Model-Derived Source Apportionment, Atmos. Environ. (2013), doi: 10.1016/j.atmosenv.2013.11.033. • Lefohn A.S., et al. (2008), Characterizing long-term changes in surface ozone levels in the United States (1080-2005), Atmos. Environ., 42: 8252-8262, doi:10.1016/j.atmosenv.2008.07.060. • Nielsen-Gammon et al., 2005. A conceptual model for eight hour ozone exceedances in Houston, Texas, Part 1: Background ozone levels in eastern Texas. HARC/TERC/TCEQ report, project H12.2004.8HRA. January 29, 2005. • Oltmans, S.J., Lefohn, A.S., Shadwick, D., Harris, J.M., Scheel, H.E., Galbally, I., Tarasick, D.W., Johnson, B.J., Brunke, E.-G., Claude, H., Zeng, G., Nichol, S., Schmidlin, F., Davies, J., Cuevas, E., Redondas, A., Naoe, H., Nakano, T., Kawasato, T., (2012), Recent Tropospheric Ozone Changes – A Pattern Dominated by Slow or No Growth, Atmos. Environ. (2012), doi: 10.1016/j.atmosenv.2012.10.057.
References • Oltmans, Samuel J., Allen S. Lefohn, Joyce M. Harris and Douglas S. Shadwick, (2008), Background ozone levels of air entering the west coast of the U.S. and assessment of longer-term changes, Atmospheric Environment (2008), doi:10.1016/j.atmosenv.2008.03.034. • Parrish, D.D., D. B. Millet, and A.H. Goldstein, 2009, Increasing ozone in marine boundary layer inflow at the west coasts of North America and Europe, Atmos. Chem. Phys., 9: 1303-1323, www.atmos-chem-phys.net/9/1303/2009/. • Parrish, D. D., et al. (2012), Long-term changes in lower tropospheric baseline ozone concentrations at northern mid-latitudes, Atmos. Chem. Phys., 12, 11,485-11,504, doi:10.5194/acp-12-11485-2012. • Reidmiller et al., 2009, The influence of foreign vs. North American emissions on surface ozone in the US. Atmos. Chem. Phys. 9, 5027-5042. • Vingarzan, 2004. A review of ozone background levels and trends. Atmos. Environ. 38: 3831-3442. • Wang, H., D. Jacob, P. Le Sager, D. Streets, R. Park, A. Gilliland, and A. van Donkelaar, (2009), Surface ozone background in the United States: Canadian and Mexican pollution influences, Atmos. Environ., 43: 1310-1319, doi:10.1016/j.atmosenv.2008.11.036. • Zhang et al., 2008, Transpacific transport of ozone pollution and the effect of recent Asian emission increases on air quality in North America: an integrated analysis using satellite, aircraft, ozonesonde, and surface observations, Atmos. Chem. Phys., 8:6117-6136, 2008. • Zhang, L., J. D. Jacob, N.V. Downey, D. A. Wood,D. Blewitt, C. C. Carouge, A. van Donkelaar, D. B. A. Jones, L. T. Murray, and Y. Wang (2011), Improved estimate of the policy-relevant background ozone in the United States using the GEOS-Chem global model with 1/2 degrees 2/3 degrees horizontal resolution over North America, Atmos. Environ., 45, 6769–6776, doi:10.1016/j.atmosenv.2011.07.054.
References • Wigder, N. L., D. A. Jaffe, F. L. Herron-Thorpe, and J. K. Vaughan (2013), Influence of daily variations in baseline ozone on urban air quality in the United States Pacific Northwest, J. Geophys. Res., 118, doi:10.1029/2012JD018738. • Lin, M., et al. (2012), Transport of Asian ozone pollution into surface air over the western United States in spring, J. Geophys. Res., 117, D00V07, doi:10.1029/2011JD016961. • McDonald-Buller et al. (2011), Establishingpolicy relevant background (PRB) ozone concentrations in the United States, Environ. Sci. Technol., 45: 9484-9497, dx.doi.org/10.1021/es2022818. • Emery et al. (2012), Regional and global modelingestimates of policy relevant background ozone over the United States, Atmos. Environ., doi:10.1016/j.atmosenv.2011.11.012. • Pfister et al. (2013), Quantifying the contribution of inflow on surface ozone over Californiaduringsummer 2008, J. Geophys. Res., 118(21):12,282-12,299, doi:10.1002/2013JD020336. • Smith, J., F. Mercado, and M. Estes (2013), Characterization of Gulf of Mexico background ozone concentrations, presented at CMAS conference, October 2013.