Download
1 / 15
150 likes | 230 Views
This procedure explains how to measure the phase angle difference between two sinusoidal waveforms using an oscilloscope. Follow the steps provided to ensure accurate measurements. Make sure to connect the leading waveform to channel A and adjust settings accordingly for precise readings. Use the cursors and controls as instructed to determine the phase angle between the waveforms. This guide simplifies the process of phase angle measurement using an oscilloscope.

E N D
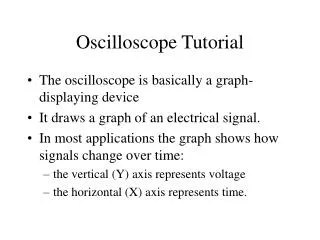
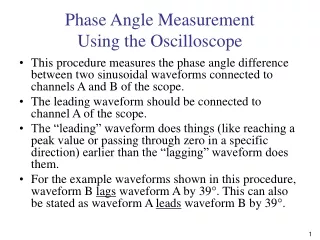
Phase Angle MeasurementUsing the Oscilloscope • This procedure measures the phase angle difference between two sinusoidal waveforms connected to channels A and B of the scope. • The leading waveform should be connected to channel A of the scope. • The “leading” waveform does things (like reaching a peak value or passing through zero in a specific direction) earlier than the “lagging” waveform does them. • For the example waveforms shown in this procedure, waveform B lags waveform A by 39°. This can also be stated as waveform A leads waveform B by 39°.
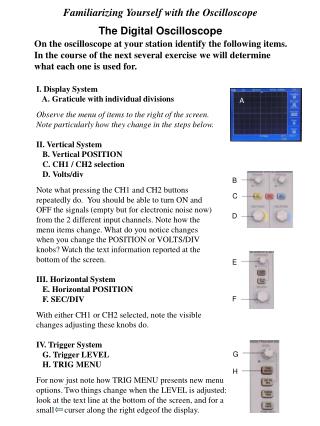
1. Turn on Power 3. If DIGITAL MEMORY is not displayed, press this button 2. Adjust the FOCUS and INTENSITY to obtain a clear, readable display. 4. If the screen text is on, repeatedly press this button until it turns off
5. Make sure all three VAR knobs are in the CAL position 6. Set the TRIG LEVEL knob to near mid-range (pointing upward).
7. Press the GND buttons on channels A and B to disconnect the input signals and “ground” the channels (zero voltage).
8. Adjust the Y POS knobs for channels A and B until both traces line up with the center horizontal grid line. Do not change these controls at any other time. 9. If necessary, adjust the X POS knob to start the traces at the left side of the grid
10. Press the GND buttons on both channels again to display the waveforms. 11. Press the green AUTO SET button to initialize the scope settings.
12. Adjust the channel A and B voltage controls to display the tallest waveforms possible while keeping the waveforms on the screen. Do not change the Y POS settings. One Cycle 13. Adjust the TB (time base) and TRIG LEVEL controls so that slightly more than one full cycle (period) at the zero crossings is displayed for both waveforms 14. Press this button to turn on the screen text.
16. Press this button to allow control of the time cursors for measuring X or horizontal distances.
19. Press the RETURN button 17. Use these two buttons to position the left cursor at the point that the A trace passes through zero (center horizontal grid line) with an upward slope. 18. Use these two buttons to position the right cursor at the point that the A trace passes through zero (center horizontal grid line) with an upward slope.
Note the display of the period and frequency of the waveform (as measured by the cursors) 20. Press the MODE button.
22. Press the RETURN button 21. Repeatedly press this button until PH (phase) is highlighted and the measurement at the top of the screen changes to Δt = 360°
24. Use these two buttons to position the right cursor at the point that the B trace first passes through zero (center horizontal grid line) with an upward slope.
25. The cursor measurement displayed at the top of the screen is the phase angle difference between the channel A and B waveforms. In the example shown, waveform B lags waveform A by 39.0 degrees.