Download
1 / 91
910 likes | 931 Views
Explore the latest data on Wyoming's labor market and economy in the 2018 Wyoming Workforce Annual Report presented by Michael Moore, Editor Research & Planning, Wyoming Department of Workforce Services.

E N D
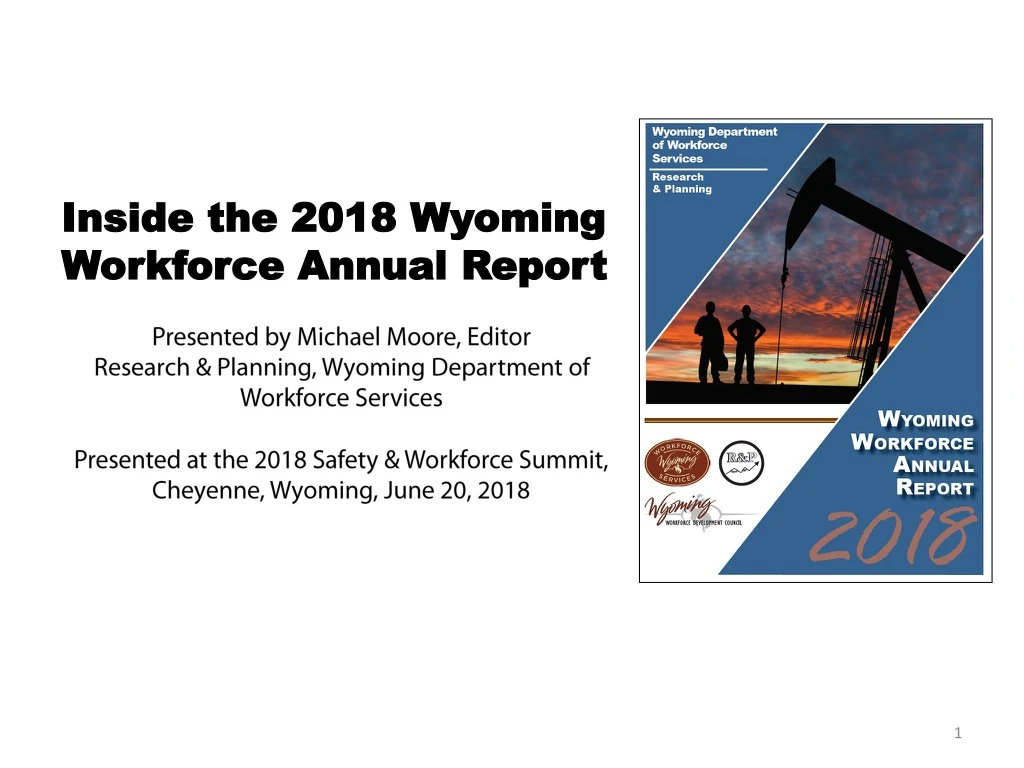
Inside the 2018 Wyoming Workforce Annual Report Presented by Michael Moore, EditorResearch & Planning, Wyoming Department of Workforce Services Presented at the 2018 Safety & Workforce Summit, Cheyenne, Wyoming, June 20, 2018
Research & Planninghttp://doe.state.wy.us/LMI ES OUR ORGANIZATION: R&P is an exclusively statistical entity within the Wyoming Department of Workforce Services. WHAT WE DO: R&P collects, analyzes, and publishes timely and accurate labor market information (LMI) meeting established statistical standards. OUR CUSTOMERS: LMI makes the labor market more efficient by providing the public and the public’s representatives with the basis for informed decision making. Inside the 2018 Wyoming Workforce Annual Report | Research & Planning, Wyoming DWS
Labor Market Information ES "Labor Market Information (LMI) is an applied science; it is the systematic collection and analysis of data which describes and predicts the relationship between labor demand and supply." - The States' Labor Market Information Review,ICESA, 1995, p. 7. • Different programs and datasets provide insight into different aspects of Wyoming’s labor market and economy: • Quarterly Census of Employment and Wages (QCEW) provides a count the number of jobs worked • Local Area Unemployment Statistics (LAUS) estimates represent the number of persons employed and unemployed • Wage records provide insight into the labor market – demographics, earnings, hours worked, number of employers, etc. Inside the 2018 Wyoming Workforce Annual Report | Research & Planning, Wyoming DWS
Wyoming Workforce Annual Report 2018 ES • Published each year • Usually distributed at the Workforce & Safety Summit • Includes information on our regular data in addition to special projects and publications • Past reports available online by clicking on the “Publications” link on our website Inside the 2018 Wyoming Workforce Annual Report | Research & Planning, Wyoming DWS
ES Chapter 1: Wyoming Adds Jobs in Late 2017 Inside the 2018 Wyoming Workforce Annual Report | Research & Planning, Wyoming DWS
Chapter 1: Wyoming Adds Jobs in Late 2017 ES • Wyoming lost jobs 2015Q2-2017Q3 • Moderate job growth in 2017Q4 (less than 1%) Figure: Over-the-Year Percent Change in Average Monthly Employment in Wyoming and the U.S., 2015-2017 See page 5 Inside the 2018 Wyoming Workforce Annual Report | Research & Planning, Wyoming DWS
Chapter 1: Wyoming Added Jobs in Late 2017 ES Industries with Job Growth, 2016Q3-2017Q3: • Mining (700 jobs, 3.6%) • Manufacturing (200 jobs, 2.1%) • Financial Activities (110 jobs, 0.9%) • Professional & Business Services (500 jobs, 2.7%) • Leisure & Hospitality (200 jobs, 0.6%) Source: Current Employment Statistics. Inside the 2018 Wyoming Workforce Annual Report | Research & Planning, Wyoming DWS
Chapter 1: Wyoming Added Jobs in Late 2017 ES What is an Economic Downturn? • A period of at least two consecutive quarters with over-the-year decreases in total employment (number of jobs) and total wages. • Two periods of economic downturn in the last 10 years: • Previous downturn: 2009Q1-2010Q1 • Most recent downturn: 2015Q2-2016Q4 Inside the 2018 Wyoming Workforce Annual Report | Research & Planning, Wyoming DWS
ES Chapter 2: Some Industries Experience Wage, Job Growth in 2017Q3 Inside the 2018 Wyoming Workforce Annual Report | Research & Planning, Wyoming DWS
Chapter 2: Some Industries Experience Wage, Job Growth in 2017Q3 ES The Differences in Economic Downturns • Previous Economic Downturn • 2009Q1-2010Q1 • 5 quarters • Coal bed methane collapse • Began during national Great Recession • Other states lost jobs too • Recent Economic Downturn • 2015Q2-2016Q4 • 7 quarters • Oil and natural gas prices fell; demand for coal dropped • Surrounding states saw job growth • People could go elsewhere for work Inside the 2018 Wyoming Workforce Annual Report | Research & Planning, Wyoming DWS
Chapter 2: Some Industries Experience Wage, Job Growth in 2017Q3 ES Figure: Over-the-Year Percent Change in Average Monthly Employment in the U.S., Colorado, and Wyoming, 2008Q1-2017Q3 See page 15 Inside the 2018 Wyoming Workforce Annual Report | Research & Planning, Wyoming DWS
Chapter 2: Some Industries Experience Wage, Job Growth in 2017Q3 ES Figure: Over-the-Year Percent Change in Average Monthly Employment and Total Wages for Wyoming, 2008Q1-2017Q3 See page 5 Inside the 2018 Wyoming Workforce Annual Report | Research & Planning, Wyoming DWS
Chapter 2: Some Industries Experience Wage, Job Growth in 2017Q3 ES Figure: Average Monthly Employment (Number of Jobs Worked) for Wyoming, 2008Q1-2017Q3 See page 8 Inside the 2018 Wyoming Workforce Annual Report | Research & Planning, Wyoming DWS
Chapter 2: Some Industries Experience Wage, Job Growth in 2017Q3 ES Mining, Quarrying, & Oil & Gas Extraction (NAICS 21) See page 10 Inside the 2018 Wyoming Workforce Annual Report | Research & Planning, Wyoming DWS
Chapter 2: Some Industries Experience Wage, Job Growth in 2017Q3 ES Construction (NAICS 23) See page 11 Inside the 2018 Wyoming Workforce Annual Report | Research & Planning, Wyoming DWS
Chapter 2: Some Industries Experience Wage, Job Growth in 2017Q3 ES Manufacturing (NAICS 31-33) See page 11 Inside the 2018 Wyoming Workforce Annual Report | Research & Planning, Wyoming DWS
Chapter 2: Some Industries Experience Wage, Job Growth in 2017Q3 ES Figure: Over-the-Year Percent Change in Average Monthly Employment (Number of Jobs Worked) in Wyoming by County, 2016Q3-2017Q3 See page 13 Inside the 2018 Wyoming Workforce Annual Report | Research & Planning, Wyoming DWS
ES Chapter 3: Economic Impacts of Growing and Potential Industries on the Wyoming Economy Inside the 2018 Wyoming Workforce Annual Report | Research & Planning, Wyoming DWS
Chapter 3: Economic Impacts of Growing and Potential Industries on the Wyoming Economy ES What Happens When Jobs Are Added to an Industry? IMPLAN economic impact modeling system helps R&P analysts understand the effects of adding jobs to an industry. Three types of impact: • Direct impacts: Result of actual project spending • Indirect impacts: Result of business-to-business spending • Induced impacts: Result of household spending Inside the 2018 Wyoming Workforce Annual Report | Research & Planning, Wyoming DWS
Chapter 3: Economic Impacts of Growing and Potential Industries on the Wyoming Economy ES What Happens When Jobs Are Added to an Industry? Example: A new construction project. • Direct impacts: A construction manager is hired for the project. • Indirect impacts: The construction company purchases lumber from a local supplier. • Induced impacts: The construction manager takes his family out to dinner and a movie. Inside the 2018 Wyoming Workforce Annual Report | Research & Planning, Wyoming DWS
Chapter 3: Economic Impacts of Growing and Potential Industries on the Wyoming Economy ES What Happens When Jobs Are Added to an Industry? For this analysis, four industries were chosen as examples: • Coal mining (NAICS 2121) - established industry. • Wind electric power generation (NAICS 221115) - emerging industry. • Commercial-scale slaughterhouse (animal slaughter except poultry; NAICS 311611) - potential diversification industry. • Limited-service restaurants (NAICS 722513) - low impact industry. Inside the 2018 Wyoming Workforce Annual Report | Research & Planning, Wyoming DWS
Chapter 3: Economic Impacts of Growing and Potential Industries on the Wyoming Economy ES Figure: Direct, Indirect, and Induced Impacts on Employment when 100 Jobs are Added to Four Selected Industries in Wyoming What Happens When Jobs Are Added to an Industry? See page 16 Inside the 2018 Wyoming Workforce Annual Report | Research & Planning, Wyoming DWS
Chapter 3: Economic Impacts of Growing and Potential Industries on the Wyoming Economy ES Example: Adding 100 Jobs to a Commercial Slaughterhouse (animal slaughter except poultry): • Beef cattle ranching & farming, including feedlots: 249 jobs • Animal production, except cattle & poultry & eggs: 101 jobs • Truck transportation: 43 jobs See pages 19-20 Inside the 2018 Wyoming Workforce Annual Report | Research & Planning, Wyoming DWS
ES Chapter 4: Wyoming Population Declines from 2016 to 2017 Inside the 2018 Wyoming Workforce Annual Report | Research & Planning, Wyoming DWS
Chapter 4: Wyoming Population Declines from 2016 to 2017 ES Wyoming Population Estimates 2016 Population: 584,910 2017 Population: 579,315 Change: -5,595, or -1.0% • Natural increase of 2,666 individuals (7,513 births versus 4,847 deaths) • Net migration = -8,285 Source: U.S. Census Bureau. Inside the 2018 Wyoming Workforce Annual Report | Research & Planning, Wyoming DWS
Chapter 4: Wyoming Population Declines from 2016 to 2017 ES Figure: Estimated Resident Population of Wyoming, 2008-2017 See page 21 Inside the 2018 Wyoming Workforce Annual Report | Research & Planning, Wyoming DWS
ES Chapter 5: Demographics of Wyoming’s Workforce Inside the 2018 Wyoming Workforce Annual Report | Research & Planning, Wyoming DWS
Chapter 5: Demographics of Wyoming’s Workforce ES Total Number of Persons Working in Wyoming at Any Time 2016 Total: 353,917 2017 Total: 340,986 Change: -12,931, or -3.7% Source: Wage Records database. Research & Planning, WY DWS. Inside the 2018 Wyoming Workforce Annual Report | Research & Planning, Wyoming DWS
Chapter 5: Demographics of Wyoming’s Workforce ES Figure: Total Number of Persons Working in Wyoming at Any Time, 2008-2017 Persons Working at Any Time See page 23 Inside the 2018 Wyoming Workforce Annual Report | Research & Planning, Wyoming DWS
Chapter 5: Demographics of Wyoming’s Workforce ES Figure: Total Persons Working in Wyoming at Any Time by Gender, 2008-2017 Persons Working by Gender See page 25 Inside the 2018 Wyoming Workforce Annual Report | Research & Planning, Wyoming DWS
Chapter 5: Demographics of Wyoming’s Workforce ES Figure: Total Persons Working in Wyoming at Any Time by Age, 2008-2017 See page 26 Inside the 2018 Wyoming Workforce Annual Report | Research & Planning, Wyoming DWS
Chapter 5: Demographics of Wyoming’s Workforce ES • Gender Wage Gap • 2017 Average Annual Wage: • Women – $28,822 • Men – $45,267 • Women earned 63.7 cents for every $1 earned by men. • Total wages do not account for several variables: • Occupation • Hours worked • Experience • Education • & more Inside the 2018 Wyoming Workforce Annual Report | Research & Planning, Wyoming DWS
Chapter 5: Demographics of Wyoming’s Workforce ES Gender Wage Gap In 2017, Research & Planning was instructed by the Wyoming legislature to complete a comprehensive study on the state’s gender wage gap. Scheduled to be published October 2018. Will include variables such as industry, occupation, age, hours worked, and continuous employment. Inside the 2018 Wyoming Workforce Annual Report | Research & Planning, Wyoming DWS
ES Chapter 6: Wyoming’s Unemployment Rate Decreases as Labor Force Shrinks Inside the 2018 Wyoming Workforce Annual Report | Research & Planning, Wyoming DWS
Chapter 6: Wyoming’s Unemployment Rate Decreases as Labor Force Shrinks ES • Local Area Unemployment Statistics (LAUS) Definitions • Labor force: The number of employed plus the number of unemployed individuals. Excludes: • Persons under 16 • Inmates of institutions • Member of the Armed Forces • Unemployed: People who don’t have jobs but are currently looking for employment. Counted by place of residence. • Unemployment rate: Number of unemployed people divided by the total number of people in the labor force. Inside the 2018 Wyoming Workforce Annual Report | Research & Planning, Wyoming DWS
Chapter 6: Wyoming’s Unemployment Rate Decreases as Labor Force Shrinks ES Figure: Wyoming Labor Force and Unemployment Rate, 2008-2017 See page 30 Inside the 2018 Wyoming Workforce Annual Report | Research & Planning, Wyoming DWS
Chapter 6: Wyoming’s Unemployment Rate Decreases as Labor Force Shrinks ES The Differences in Economic Downturns • Previous Economic Downturn • 2009Q1-2010Q1 • 5 quarters • Labor force increases • High unemployment rate • Surrounding states lose jobs • Wyoming workers who lost jobs couldn’t go to another state for work and claimed UI benefits • Recent Economic Downturn • 2015Q2-2016Q4 • 7 quarters • Labor force decreases • Low unemployment rate • Surrounding states gain jobs • Wyoming workers who lost jobs could go elsewhere for work and didn’t file for UI benefits. Inside the 2018 Wyoming Workforce Annual Report | Research & Planning, Wyoming DWS
ES Chapter 7: Unemployment Insurance Claims Decrease in 2017 Inside the 2018 Wyoming Workforce Annual Report | Research & Planning, Wyoming DWS
Chapter 7: Unemployment Insurance Claims Decrease in 2017 ES See page 32 Inside the 2018 Wyoming Workforce Annual Report | Research & Planning, Wyoming DWS
Chapter 7: Unemployment Insurance Claims Decrease in 2017 ES Figure: Unemployment Insurance Benefits Paid in Wyoming, 1997-2017 See page 35 Inside the 2018 Wyoming Workforce Annual Report | Research & Planning, Wyoming DWS
ES Chapter 8: Mining, Leisure & Hospitality Lead Projected Growth Inside the 2018 Wyoming Workforce Annual Report | Research & Planning, Wyoming DWS
Chapter 8: Mining, Leisure & Hospitality Lead Projected Growth ES • Short-Term Projections, 2017-2019 • Based on QCEW data • Available at industry and occupational levels • Based on recent trends of how employment levels respond to market conditions • Represent a point-in-time estimate Inside the 2018 Wyoming Workforce Annual Report | Research & Planning, Wyoming DWS
Chapter 8: Mining, Leisure & Hospitality Lead Projected Growth ES • Wyoming Short-Term Industry Projections, 2017-2019 • Wyoming’s employment is projected to grow by 7,333 jobs (2.7%) from 2017 to 2019 • Largest job growth is expected in: • Mining, including oil & gas (2,410 jobs, or 12.5%) • Leisure & hospitality (1,643, or 4.5%) • Job growth is forecast for all sectors except: • Information • Public administration Inside the 2018 Wyoming Workforce Annual Report | Research & Planning, Wyoming DWS
Chapter 8: Mining, Leisure & Hospitality Lead Projected Growth ES • Wyoming Short-Term Occupational Projections, 2017-2019 • Occupational projections account for other types of openings: • Growth – new jobs. • Exits – workers leaving the workforce. • Transfers – workers changing occupations. • Total – growth + exits + transfers. Inside the 2018 Wyoming Workforce Annual Report | Research & Planning, Wyoming DWS
Chapter 8: Mining, Leisure & Hospitality Lead Projected Growth ES Wyoming Short-Term Occupational Projections, 2017-2019 Example: Heavy & Tractor-Trailer Truck Drivers (SOC 53-3032) Inside the 2018 Wyoming Workforce Annual Report | Research & Planning, Wyoming DWS
Chapter 8: Mining, Leisure & Hospitality Lead Projected Growth ES Wyoming Short-Term Occupational Projections, 2017-2019: Education Figure: Projected Total Job Openings in Wyoming by Typical Educational Requirement, 2017-2019 • The majority of all projected openings (73.1%) are in jobs requiring a high school diploma or less. See page 40 Inside the 2018 Wyoming Workforce Annual Report | Research & Planning, Wyoming DWS
Chapter 8: Mining, Leisure & Hospitality Lead Projected Growth ES Wyoming Short-Term Occupational Projections, 2017-2019: Education Figure: Wyoming Occupational Fatalities, 1992-2016 See page 42 Inside the 2018 Wyoming Workforce Annual Report | Research & Planning, Wyoming DWS
ES Chapter 9: How to Calculate Turnover Rates by County, Industry Inside the 2018 Wyoming Workforce Annual Report | Research & Planning, Wyoming DWS
Chapter 9: How to Calculate Turnover Rates by County, Industry ES Figure: Turnover Rate Calculation for Construction (NAICS 23) in Wyoming, 2017Q2 See page 43 Inside the 2018 Wyoming Workforce Annual Report | Research & Planning, Wyoming DWS
Chapter 9: How to Calculate Turnover Rates by County, Industry ES Hiring Activity Resumes for Some Industries in 2017 • 2016Q3-2017Q3, total hires increased in: • Mining (916 more hires, or 50.2%) • Wholesale Trade, Transportation, Warehousing, & Utilities (200, or 8.4%) • Agriculture (116, or 18.8%) See page 44 Inside the 2018 Wyoming Workforce Annual Report | Research & Planning, Wyoming DWS