Download
1 / 9
90 likes | 217 Views
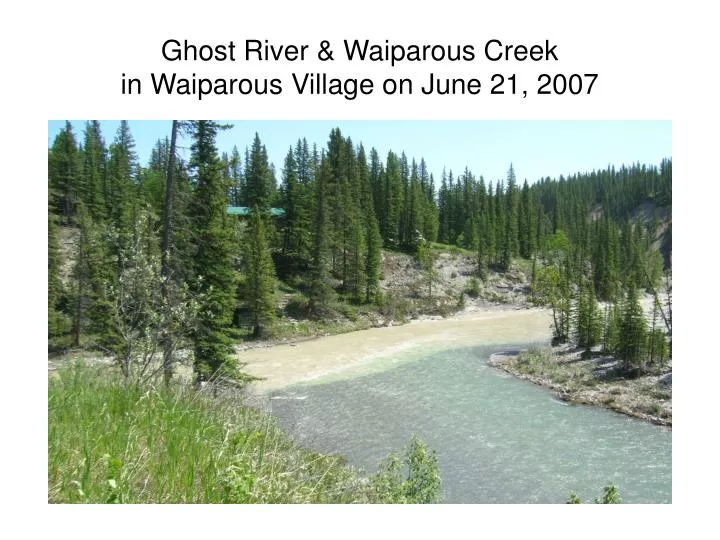
Ghost River & Waiparous Creek in Waiparous Village on June 21, 2007. WATER QUALITY STUDY OF WAIPAROUS CREEK, FALLENTIMBER CREEK AND GHOST RIVER. Prepared for Alberta Environment & Completed by Clearwater Environmental Consultants in February 2006. Study Objectives set by AENV.

E N D
Ghost River & Waiparous Creek in Waiparous Village on June 21, 2007
WATER QUALITY STUDY OF WAIPAROUS CREEK, FALLENTIMBER CREEKAND GHOST RIVER Prepared for Alberta Environment & Completed by Clearwater Environmental Consultants in February 2006
Study Objectives set by AENV • Attempt to determine whether there is a linkage between random camping and off-highway vehicles (OHV) activities and water quality in these three rivers • Document baseline water quality data prior to the implementation of an access management plan by the Alberta Government (SRD)
Study Activities • Water quality monitoring by AENV during 2004 and 2005 (some assistance provided by GWAS) • Continuous measurements of turbidity (among other parameters) as surrogate for total suspended solids (TSS) which is a key parameter indicative of land disturbance and water quality degradation • Counts of vehicular movements were taken at three sites along Waiparous Creek
Key Findings • Sediment loading coefficients in the lower regions of Waiparous Creek and Ghost River were much greater than would be expected in rivers draining a similarly forested environment in the upper foothills of southern Alberta (they were even greater than loading coefficients in streams draining agricultural lands at lower elevations where sediment erosion is a common problem)
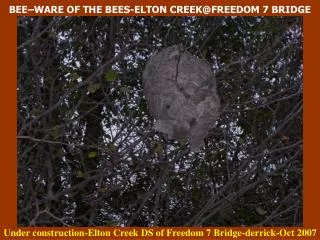
Key Findings (continued) • Weight of evidence argument links motorized recreational activities with the large increase in sediment load between the upstream and downstream stations on Waiparous Creek • Mechanism of sediment release is best explained by observationsof the erosion caused by vehicles on OHVs tracks at fording points, where tracks run into the stream, and from tracks along the banks Note: Roger Meyer of SRD is quoted as telling the study team “Restriction of road usage to the winter months [in the past] limited the release of silt by erosion to the creek.“ Now these roads are accessible during the wet summer months when they are most susceptible to erosion.
More Conclusions of Analysis • Increases in nutrients, bacteria and certain metals (Al, Fe) are often associated with high TSS loads • High TSS loads may have significant ecological effects downstream when sediments are deposited in slower flowing reaches of the river • Although Bow river water quality is not affected (because the Ghost Reservoir acts like a settling tank, sediment build-up in the reservoir should be of concern to Transalta (sediment loading over just a 2 months period was 1,265,412kg which is about 500 cubic metres or 20,000 cubic feet of sediment most of which ends up in the reservoir)
More Details • TSS Loading coefficient increased between the upper Waiparous and the DND Camp from 6.34 kg/ha to 47.1kg/ha • For the actual area along Waiparous Creek the loading coefficient is even higher, i.e. 57kg/ha which is almost ten times higher than upstream • Comparative values for the Elbow River above and below Bragg Creek are 1.74 and 12.04 kg/ha respectively.Note: Loading coefficients are the total mass of TSS in kg carried by a watercourse, divided by the area of the drainage basin over a period of time, usually calculated on an annual basis