Download
1 / 13
130 likes | 208 Views
Atomic Spectroscopy for Space Applications: Galactic Evolution l. M. P. Ruffoni , J. C. Pickering, G. Nave, C. Allende-Prieto. APOGEE is one of 4 instruments forming the third Slone Digital Sky Survey (SDSS3) It will conduct a spectroscopic survey of all stellar populations in the Milky Way

E N D
Atomic Spectroscopy for Space Applications: Galactic Evolutionl M. P. Ruffoni, J. C. Pickering, G. Nave, C. Allende-Prieto
APOGEE is one of 4 instruments forming the third Slone Digital Sky Survey (SDSS3) It will conduct a spectroscopic survey of all stellar populations in the Milky Way It will measure in the near-IR where galactic dust extinction is ~1/6 of that at visible wavelengths It will measure chemical abundances and radial velocities of 100,000 evolved stars to help explain galactic evolution
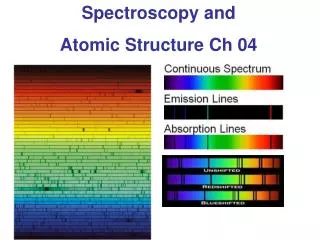
Detecting elements in stars Type Temperature Emission contains absorption lines Photosphere Hot, dense interior Section of a star Visible spectra for different star types • Finding chemical abundances • Use a 2 fit to stellar models to obtain • Stellar temperature • Surface gravity • Microturbulence parameter • Abundance of important elements • [Fe/H], [C/H], and [O/H] • Fix these then fit other abundances • The results are only as good as the model! • Absorption lines indicate the presence of an element. • Line strength is mainly linked to: • Stellar properties (e.g. temperature) • Absorption transition probability • Chemical abundance Simulated H-band spectrum for different Fe abundances. All other parameters fixed.
Measuring Transition Probabilities Transition probabilities can be obtained from emission spectra Spontaneous Absorption Stimulated Emission Emission E2 E1 n12 n12 n12 n12 A21 B12 B21 Einstein coefficients Number of experimentally measured transition probabilities in the IR: J. C. Pickering et al. Can J Phys 89 pp. 387 (2011) Better experimental transition probabilities are needed
Branching Fractions I I n n I Decay to a single level Decay to multiple levels E2 E1 n12 n12 n12 n12 E2 E1 I BF = Branching fraction I = Integrated line intensity
I Complications • Free spectral range • Spectral range determined by • Spectrometer optics • Detector sensitivity • Filter combinations • Measurement electronics • Spectrometer Response • Determined by measuring a calibrated continuum source • Tungsten lamp (IR to UV) • Deuterium lamp (UV and vacuum UV) 1.0 0.0 1.0 0.0 Normalised response 1.0 0.8 0.6 0.4 0.2 0.0 Either Select range to measure all upper level branches or Use overlapping spectra to carry calibration W lamp D2 Lamp Normalised Response I 0 4000 8000 12000 35000 45000 55000 Wavenumber / cm-1
Measuring Upper Level Lifetimes Lifetimes are commonly measured with Laser Induced Fluorescence (LIF) E2 E1 • A laser pulse is used to excite electrons in a populated lower level. 205 - 720 nm UV - visible 2)The upper level is populated 3)After time the electrons de-excite Critical Fe I transitions for theAPOGEE project 1.0 0.8 0.6 0.4 0.2 0.0 There are no transitions to populated lower levels No lines in the visible/UV Normalised Response LIF lifetimes are unavailable 0 4000 8000 12000 35000 45000 55000 Wavenumber / cm-1 No lines to carry intensity calibration BFs are unavailable
Catch-22: Branching fractions or level lifetimes Critical Fe I transitions for theAPOGEE project Solution: Invert the problem
Solution: Invert the Problem Recall from slide 2 • Line strength is mainly linked to: • Stellar properties (e.g. temperature) • Absorption transition probability • Chemical abundance The Solar Fe abundance is known. Use it to find transition probabilities APOGEE needs transition probabilities to find abundances Estimate t2 from theory Use Solar spectrum to refine A2i
Results A section of our results table:
Consistency Checking Relative transition probabilities can be found by combining absorption and emission data (Ladenburg 1933). Ratio of line strengths in emission: Ratio of line strengths in absorption: B2j B2k A2i A2j Lifetimes not needed
Results A section of our results table:
Conclusions • We have found a reliable method for obtaining IR transition probabilities • Present study has almost doubled the number of Fe transition probabilities available in the IR. • We have the data to quickly provide many more transition probabilities Number of experimentally measured transition probabilities in the IR: J. C. Pickering et al. Can J Phys 89 pp. 387 (2011) For more information: Technique: M. P. Ruffoni, Comp. Phys. Comm., accepted (2012) Results for APOGEE: M. P. Ruffoni et al., ApJ, submitted (2013) Results for GaiaESO: M. P. Ruffoni et al., ApJ, in preparation (2013)